
October 7, 2022 6:27 AM
Some investors and traders believe that the Fed may “pivot” and reduce the pace of rate hikes as soon as the November 2nd FOMC meeting. According to the CME’s Fedwatch Tool, traders are 74% sure that the FOMC will hike rates by 75bps. However, there is also 26% chance that the rate hike will only be 50bps. The reasons for a possible pivot have been numerous, including BOJ intervention, BOE intervention, RBA pivot, and the National Bank of Poland pivot. Some traders believe that tomorrow’s Non-Farm Payroll data could be the key to the Fed’s next move. Expectations are for the US economy to have added 265,000 jobs to the economy. If the print is much lower than the expectation, chances are that stocks will move higher and the DXY will move lower (i.e. there is more of a chance of a Fed pivot, which is good for stocks). However, it the print is much higher than expectations, chances are that stocks will move lower and the DXY will move higher (i.e. the Fed will feel more confident in its decision to hike rates aggressively). See my colleague Matt Weller’s complete NFP preview here.
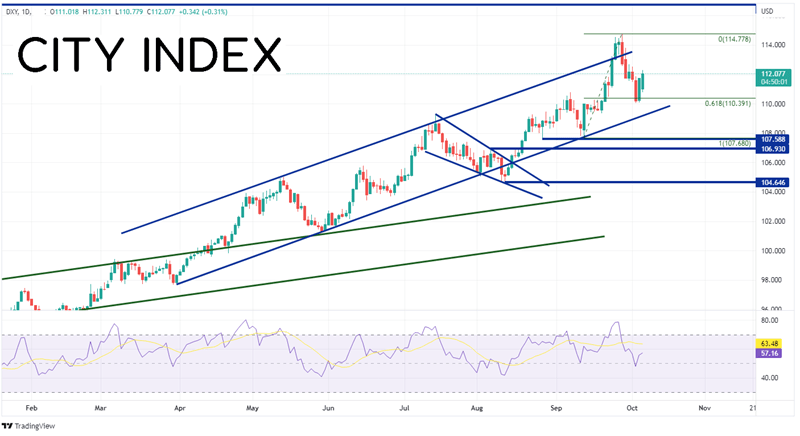
As such, the NFP release tomorrow could be one of extreme importance. Often before an important event that could affect the markets, the US Dollar seems to revert to the mean. That seems to be the case today as the DXY moves towards the middle of the range it has been in over the last 2 weeks. The DXY has been trading higher since May 2021. Since April 2022, it has moved aggressively higher in a channel from a low on March 31st at 97.60 to a high on September 28th at 114.78! On September 26th, the US Dollar Index moved above top channel line, only to reverse 2 days later and move back inside. The DXY then pulled back to the 61.8% Fibonacci retracement from the lows of September 13th to the highs of September 28th near 110.05.
Source: Tradingview, Stone X
Trade the DXY now: Login or Open a new account!
• Open an account in the UK
• Open an account in Australia
• Open an account in Singapore
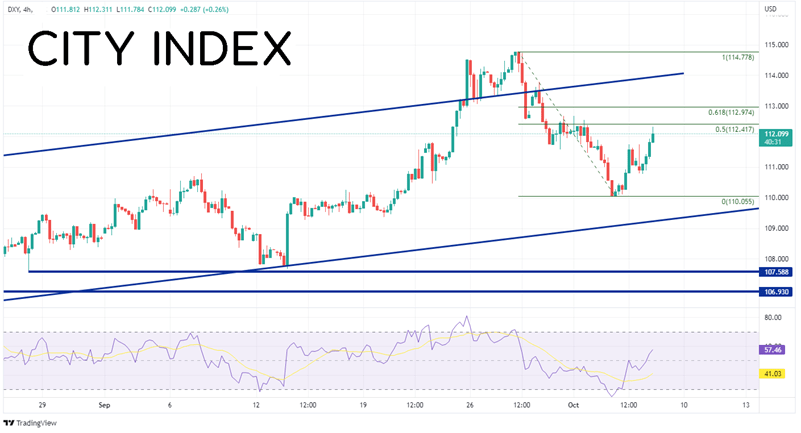
On a 240-minute timeframe, the DXY is approached the 50% retracement from the highs of September 28th to the lows of October 4th near 112.42. This is the middle of the recent range where price often gravitates to before a big event, or a reversion to the mean. If price moves above the 50% level, the next resistance is at the 61.8% Fibonacci retracement level from the same timeframe at 112.97. Above there, price can move to the top trendline of the channel near 113.90, then the recent highs at 114.78. However, if the DXY moves lower, the first support isn’t until the October 4th lows at 110.06. Below there, price can fall to the bottom trendline of the channel near 109.25, then the lows of August 26th and September 13th, near 107.59.
Source: Tradingview, Stone X
With the US Non-Farm Payroll due out on Friday morning, the DXY is moving to the 50% retracement level of the September 28th highs to the lows of October 4th. Unless there is a surprise in the markets before then, DXY is likely to sit near these levels until the data is released. However, after the release, the next move for the US Dollar will be dependent on whether or not the market believes the Fed will pivot.
Learn more about forex trading opportunities.