


The world’s most controversial (and by far our most traded) stock is in the news once again.
Tesla (TSLA) is trading more than 2% higher in pre-market trade on news that the electric vehicle manufacturer has applied to the US government to expand its Gigafactory in Texas through a $775.7 million investment that will see it add five new facilities at the plant. According to my colleague UK Josh Warner, this investment “looks set to be the next big expansion after launching new factories in Germany and the US last year and comes amid reports that Tesla promoted its boss in China, Tom Zhu, to take control over its global manufacturing and sales operations. The funds will be spent on a ‘ground up and complete interior finish out of the EV manufacturing facility’ with construction set to start this month and be completed in early 2024.”
Beyond the ongoing drama surrounding mercurial CEO Elon Musk’s focus on recreating Twitter, it’s also worth noting that Tesla reports its Q4 results later this month and has a highly-anticipated “investor day” tentatively scheduled for early March.
Technical view: Tesla (TSLA)
Looking at the chart, Tesla’s stock has seen a staggering loss of value over the past 14 months. Since peaking in November 2021, the automaker has seen its market capitalization collapse from above $1.2T to below $400B today; this ~$800B loss in value is larger than the current market capitalization of all but four US stocks (Apple, Microsoft, Alphabet, and Amazon)!
From a technical perspective, there are some signs that TSLA is setting up for at least a short-term bounce. After falling by more than 37% through December, the stock fell to an incremental 2.5-year low near $102 in the first week of January but bears have been unable to keep pushing prices lower in this week’s trade. At the same time, the stock’s 14-day RSI indicator has formed a clear bullish divergence in oversold territory over the first two weeks of the year; for the uninitiated, this setup shows a “higher low” in the RSI indicator (signaling waning selling momentum) despite a new “lower low” in price and is often seen around significant bottoms in the market.
If prices can break durably above the December 30 high at 124.60 (and ideally the 21-day EMA in the $132 area), it would confirm that a near-term bottom has formed and open the door for an extended rally toward previous-support-turned-resistance in the $167 area heading into February. That said, readers should always exercise caution when “catching a falling knife,” and a break below the year-to-date low at $102 would invalidate the setup for a bounce and open the door for more weakness into double-digit prices for the first time since mid-2020.
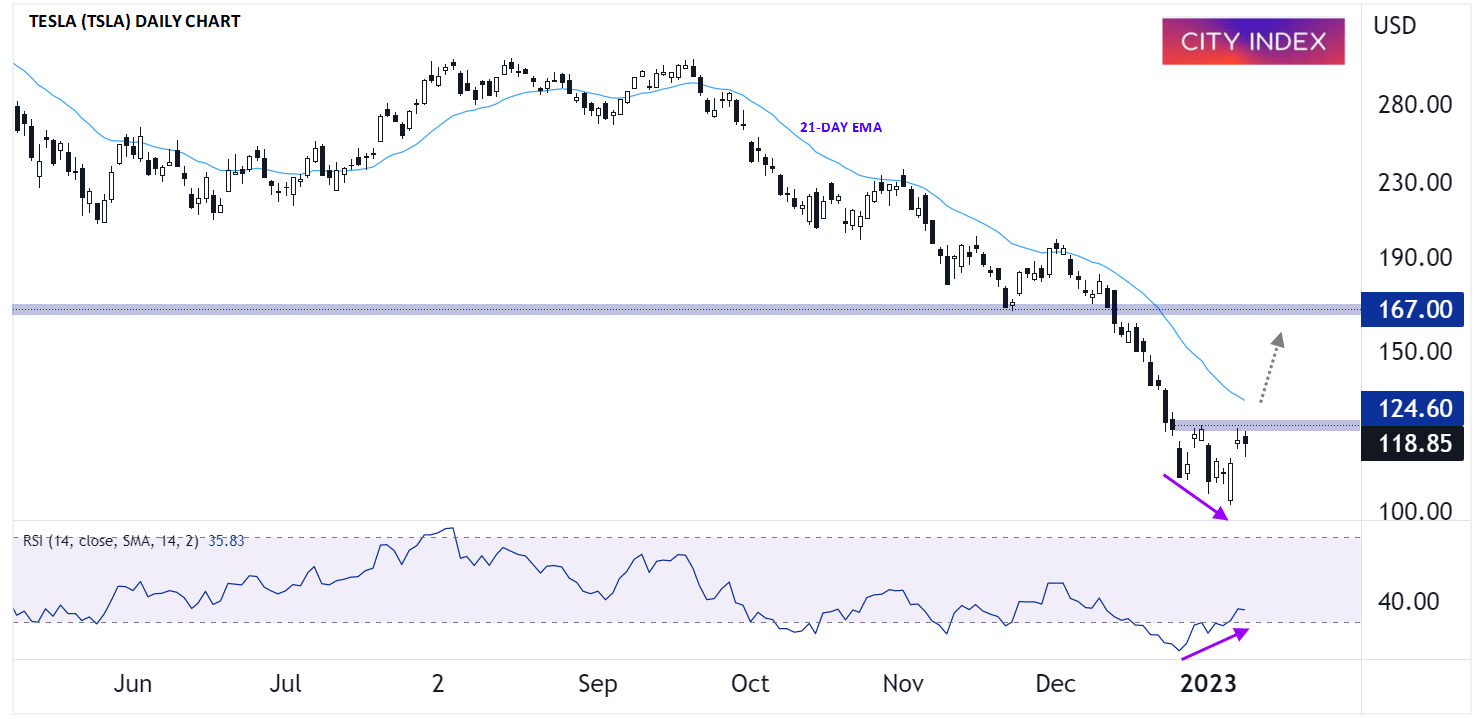
Source: StoneX, TradingView
How to trade with City Index
You can trade with City Index by following these four easy steps:
-
Open an account, or log in if you’re already a customer
• Open an account in the UK
• Open an account in Australia
• Open an account in Singapore
- Search for the market you want to trade in our award-winning platform
- Choose your position and size, and your stop and limit levels
- Place the trade
Latest market news
Today 11:14 AM
Today 08:28 AM
Yesterday 03:30 PM
Yesterday 01:23 PM
Yesterday 11:00 AM
Latest Tesla Motors articles
Yesterday 01:23 PM
April 23, 2024 01:15 PM
April 21, 2024 04:00 AM
January 25, 2024 01:48 PM