


September 28, 2022 6:06 AM
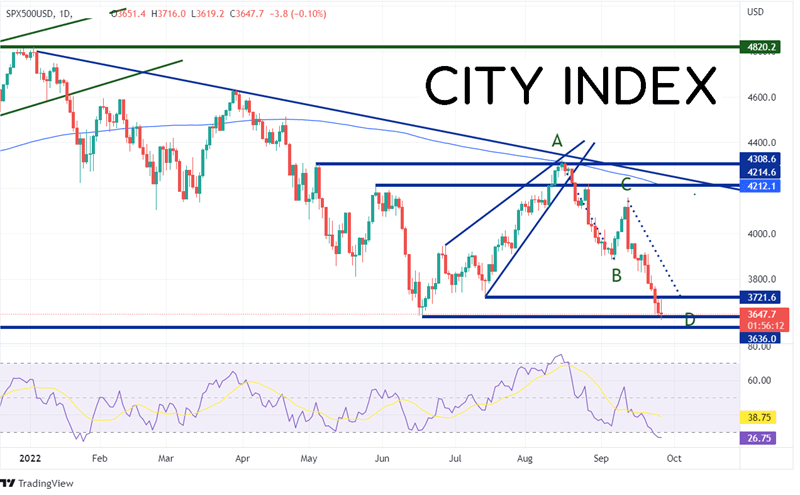
On January 4th the S&P 500 reached a record high of 4820.2. Today, the large cap index made a new low for the year, reaching an intra-day low of 3620.2, a fall of nearly 25% so far this year! The new low came on the back of soaring yields, not just in the US, but around the world. The US 10-year yield traded to its highest level since 2010, just 1 basis point below 4%. The UK 10-year Gilt reached as high as 4.5% after only being at 3.24% on Thursday! This was the highest level since 2008. And the German 10-year Bund reached its highest level since 2011, at 2.255%. In addition, central bankers were out in force over the last few days talking up interest rates. Today, the Fed’s Bullard said that “we have a serious inflation problem in the US and the credibility of inflation-targeting regime is at risk”. The BOE’s Pill said that it’s” hard not to draw conclusions that we will need significant monetary policy response” and that the “fiscal news requires a significant policy response”. And yesterday, ECB President Christine Lagarde said she expects interest rates to rise further over the next several meetings.
On June 16th, the S&P 500 made a low of 3638.8. The large cap index then bounced in an ascending wedge pattern to horizontal resistance and the 200-Day Moving Average near 4308.6 on August 16th. Since then, the S&P 500 has been moving lower in an AB=CD fashion as the index retraced 100% of the previous move. Yesterday, the move continued lower, and price reached a the new yearly low today at 3620.2.
Source: Tradingview, Stone X
Trade the S&P 500 now: Login or Open a new account!
• Open an account in the UK
• Open an account in Australia
• Open an account in Singapore
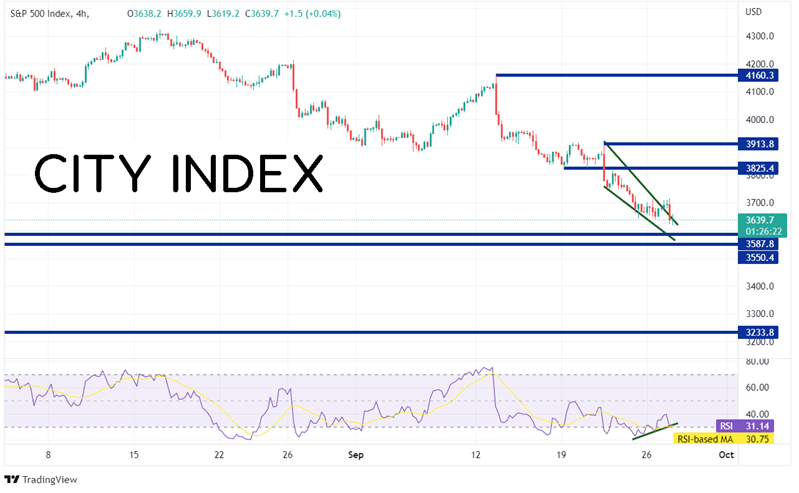
Based on the ending descending wedge of the current move, one would think that the stocks should bounce higher of the wedge. Notice that the RSI is diverging with price on the 240-minute timeframe. If the S&P 500 does bounce from current levels, the first resistance is horizontal resistance at 3825.4. Above there, price can move to the 100% retracement of the descending wedge and the highs of September 21st at 3913.8, then the highs from September 13th at 4160.3. However, if the move continues lower, first support is at the highs of September 2020 at 3587.8, then the highs from October 2020 at 3550.4. Below there, the S&P 500 can fall all the way to the lows of November 2020 near 3233.8.
Source: Tradingview, Stone X
With central bank hawks on the wires and bond yields soaring to decade highs, the S&P 500 (among other stock indices) moved to new lows on the year today. Will it continue? The technical look like the index is going to bounce. However, if yields continue to move higher, it is possible for the large cap index to continue to move lower on the year!
Learn more about forex trading opportunities.
Latest market news
Yesterday 11:09 PM
Yesterday 11:01 PM
Yesterday 04:00 PM
Yesterday 01:15 PM
Yesterday 11:30 AM
Latest Trade Ideas articles
Yesterday 11:09 PM
Yesterday 04:00 PM
Yesterday 11:30 AM
Yesterday 08:18 AM