


September 1, 2021 2:10 AM
Slowing growth hitting Iron Ore prices; trading near key levels
China released its official PMI data earlier at 50.1 vs 50.2 expected and 50.4 in July. It now sits just above the contraction/expansion level of 50 and is at its lowest level since the pandemic struck in February 2020. In addition, its non-manufacturing index fell to 47.5 vs an expected 50.3 and 53.3 last. The composite PMI was dragged below 50, which is contraction territory. The reduction in confidence from the delta variant of the conronavirus and inflationary pressures are the usual culprits for the slowdown, however, China’s crackdown on carbon emissions is also hitting the manufacturing sector. In addition to August’s weaker PMI data, July Industrial Production and Retail Sales were also much lower than June’s prints. Last week, flash PMIs also showed that manufacturing in many parts of the world were also slowing (this should be confirmed on Wednesday in the final manufacturing PMIs).
Australia releases Q2 GDP later. Australia is a large exporter of Iron Ore to China. If the print is weaker, Iron Ore and AUD/USD prices move lower.
Learn more about forex trading opportunities.
The slowdown has led to a reduction in demand for Steel. Therefore, prices of Steel components, such as Iron Ore, have also taken a hit! Using the Iron Ore front month futures contract (September) as a proxy for Iron Ore prices (FEFU21), the weekly timeframe shows that Iron Ore prices had been relatively stable in the months leading up to the pandemic. However, once global monetary stimulus has become “infinitely” accommodative, prices began to rise, as demand for Steel and Iron Ore grew. During the week of February 3rd, 2020, Iron Ore futures traded as low as 77.10. By the week of May 10th, 2021, price reached an all-time high of 226.85! During the week of July 5th, price was trading near those highs, however since then, Iron Ore fell over 50% from the February 2020 lows to the May 2021 highs and is currently trading just above horizontal support, near 146.40.
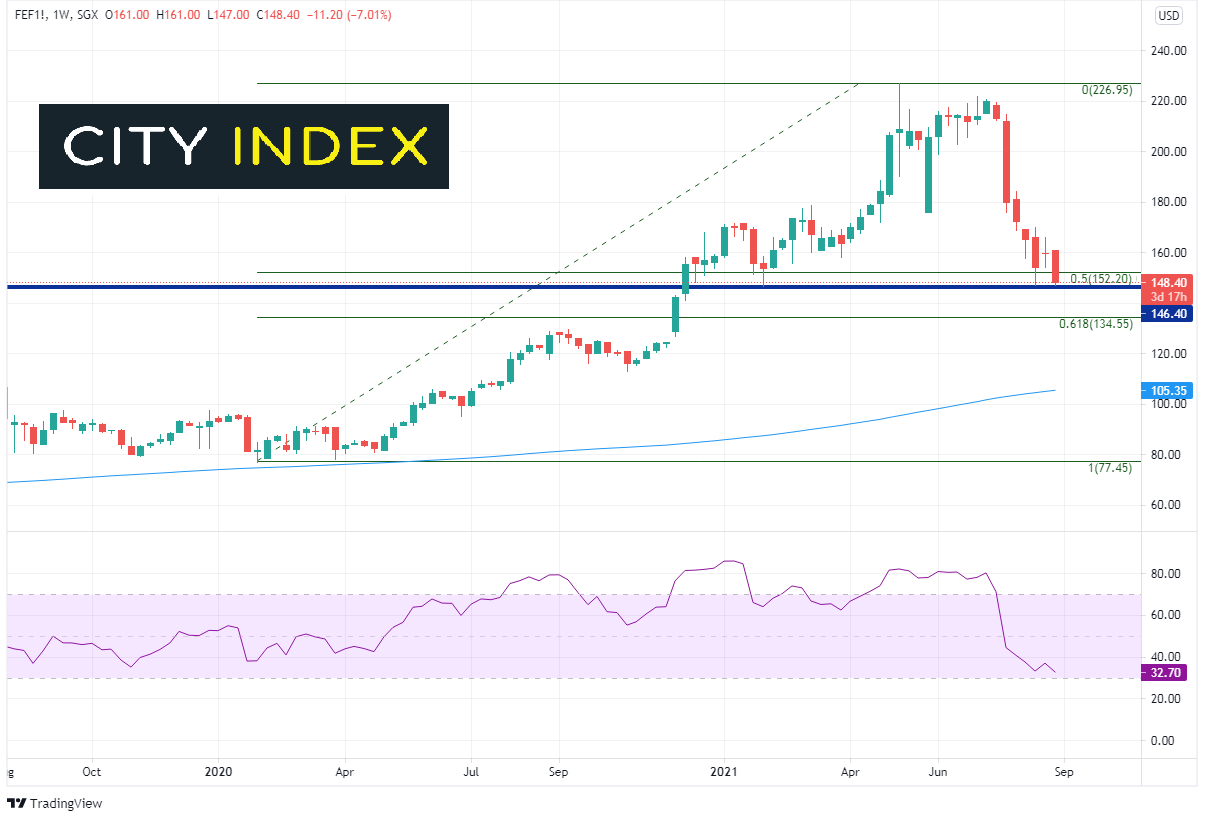
Source: Tradingview, Stone X
On a daily timeframe, Iron Ore is testing its 2021 low. If price breaks below, the next level of support is at the 61.8% Fibonacci retracement from the February 2020 low to the May 2021 high near 134.55. Horizontal support sits just below there at 129.40. Notice that the RSI has been in negative territory since the end of July, and although it tried to move back into neutral territory, it was unable to do so and has turned lower once again. If price does manage to move higher, the August highs at 169.85 act as first level of resistance, then the 200 Day Moving Average at 178.15. The gap opening, from July 29th to July 30th, acts as the next level of resistance near 194.15.
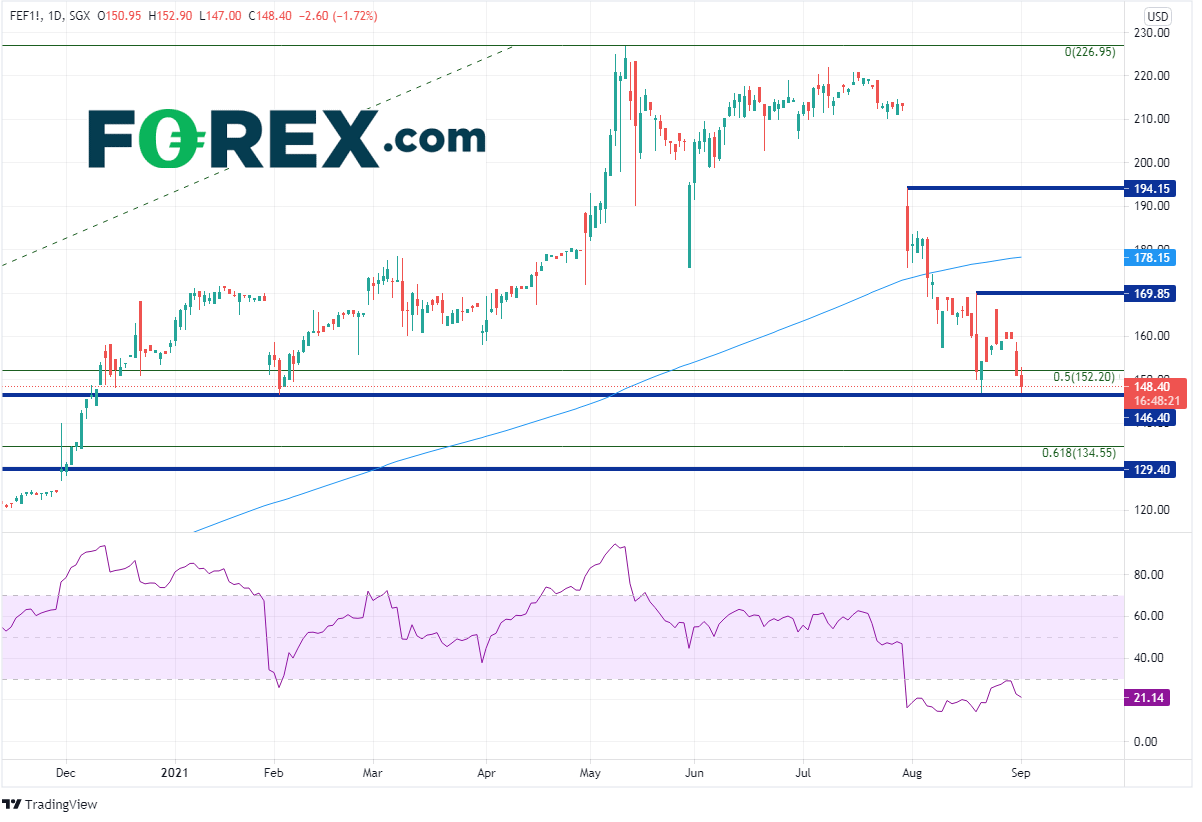
Source: Tradingview, Stone X
If the world continues to see worsening manufacturing data and/or a rise in coronavirus cases, Iron Ore may continue to be pressured further. However, with price at the 50% retracement of the February 2020 low to the May 2021 high, along the RSI in oversold territory, Iron Ore prices could be ready for a bounce.
Learn more about commodity trading opportunities.
Latest market news
Latest Commodities articles
April 17, 2024 03:02 AM
April 15, 2024 12:48 AM
April 14, 2024 11:37 PM