


April 2, 2022 2:02 AM
The US added 431,000 Non-Farm jobs to the economy in March vs an expectation of +490,000. Although the headline number fell short of expectations, the February number was revised higher: from 678,000 to 750,000. The upward revision of +72,000 jobs for February, added to the March print, makes the headline number seem more in-line with expectations.
The Unemployment Rate for March fell to 3.6% from 3.7%. This is the lowest level since the pandemic began. The Participation Rate also increased from 62.4% from 62.3%. An increase in the participation combined with a decrease in the Unemployment Rate makes for a healthy combination. In addition, Average Hourly Earnings rose from an upwardly revised 0.1% to 0.4%. The Fed wants to see earnings and wages increase with inflation, so it should be content with these results.
Everything you need to know about the Federal Reserve
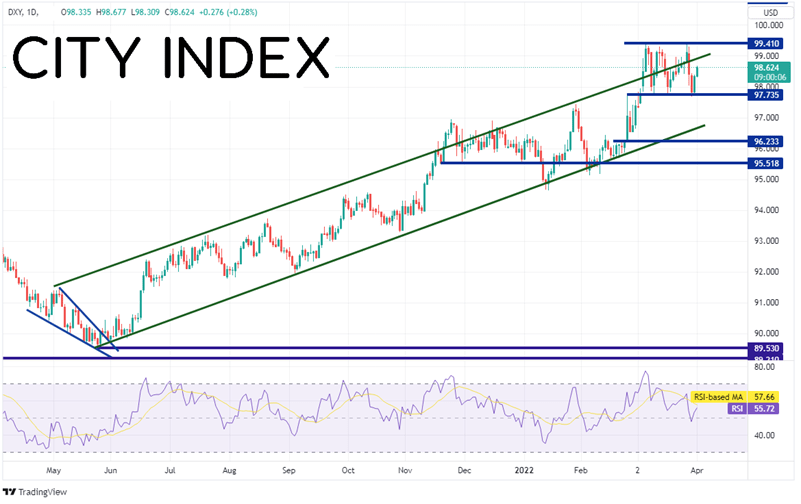
The US Dollar Index (DXY) has been moving higher in an orderly channel since May 2021. On March 4th, the index broke above the top trendline of the channel and made a high of 99.41. The DXY pulled back into the channel a few days later to 97.71 and has been trading within that range since. However, with today’s strong but in-line data, the DXY is moving higher back towards the top of the resistance zone.
Source: Tradingview, Stone X
Trade the DXY now: Login or Open a new account!
• Open an account in the UK
• Open an account in Australia
• Open an account in Singapore
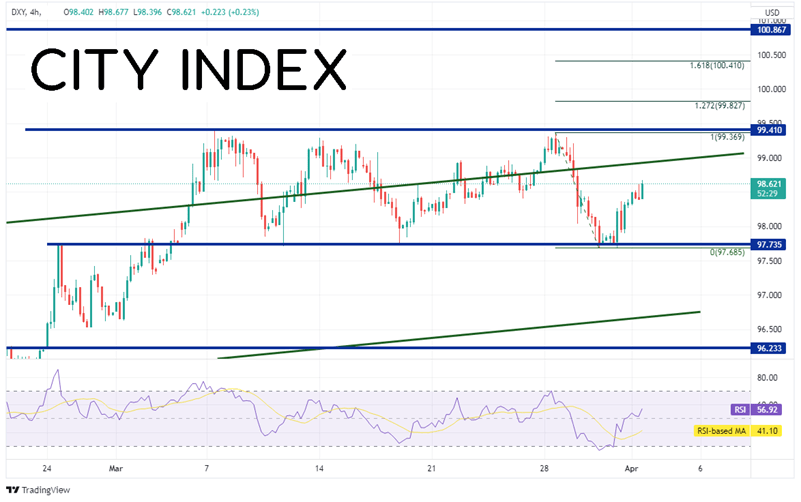
On a 240-minute timeframe, it better shows the sideways channel that the DXY has been in for the past month. First resistance is at the highs of the channel near 99.41. Above there, resistance is at the 127.2% and 161.8% Fibonacci retracement levels from the highs of March 28th to the lows of March 31st at 99.83 and 100.41, respectively. Horizontal resistance then crosses at 100.87. First support is at the low of March 31st, just below the bottom of the channel near 97.69. Below there, support is that the rising trendline for the long-term, upward sloping trendline near 96.65 then horizontal support at 96.23.
Source: Tradingview, Stone X
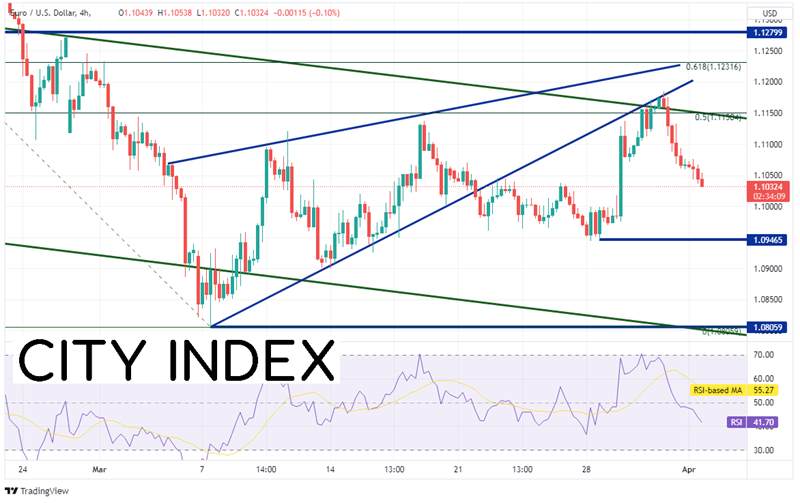
As the DXY moves higher, EUR/USD moves lower. On a 240-minute timeframe, the pair had been in an ascending wedge since March 3rd. On March 21st, EUR/USD broke below the pattern. However for the last week, price moved to test the underside of the bottom trendline of the wedge. With the US Dollar going bid today, the resistance held, and EUR/USD is moving lower. Support is at the lows form March 28th at 1.0945, then the lows from March 7th at 1.0805. Resistance is at yesterday’s highs and the bottom trendline of the wedge near 1.1184, then a confluence of resistance at the top trendline of the wedge and the 61.8% Fibonacci retracement from the highs of February 10th to the lows of March 7th near 1.1232.
Source: Tradingview, Stone X
Trade EUR/USD now: Login or Open a new account!
• Open an account in the UK
• Open an account in Australia
• Open an account in Singapore
Although the March headline NFP was weaker, the upward revision to February’s print makes March’s print a stronger number. As a result, DXY has gone bid on the back of higher expectations that the Fed will raise rates by 50bps at the next meeting.
Learn more about forex trading opportunities.
Latest market news
Yesterday 01:23 PM
Yesterday 06:01 AM
April 18, 2024 11:27 PM
Latest Trade Ideas articles

April 18, 2024 11:27 PM
April 18, 2024 04:46 PM