


July 22, 2022 5:16 AM
Earlier in the week, South Africa released its June inflation report. The headline CPI was 7.4% YoY vs 7.2% YoY expected and a June reading of “only” 6.5% YoY. This was the highest reading since May 2009. The upper bound for the SARB on its inflation target is 6% YoY. In addition, the Core CPI was 4.4% YoY vs 4.2% YoY expected and 4.1% YoY in May. As a result of the higher than expected CPI, the South African Reserve Bank (SARB) was forced to hike rates on Thursday by 75bps, vs only 50bps expected. This was the largest hike in 2 decades. The benchmark rate now sits at 5.5%. SARB Governor Kganyago said that the central bank was set on stopping the rise in inflation. The vote was not unanimous though, as only 3 members wanted to raise 75bps, while one member only wanted 50bps and another wanted 100bps! The central bank increased this year’s headline inflation expectation to 6.5% YoY vs 5.9% YoY in May. It said risks to its inflation outlook were to the upside. In addition, the SARB upped its growth forecast for this year to 2.0% from 1.7%, while lowering forecasts for 2023 and 2024.
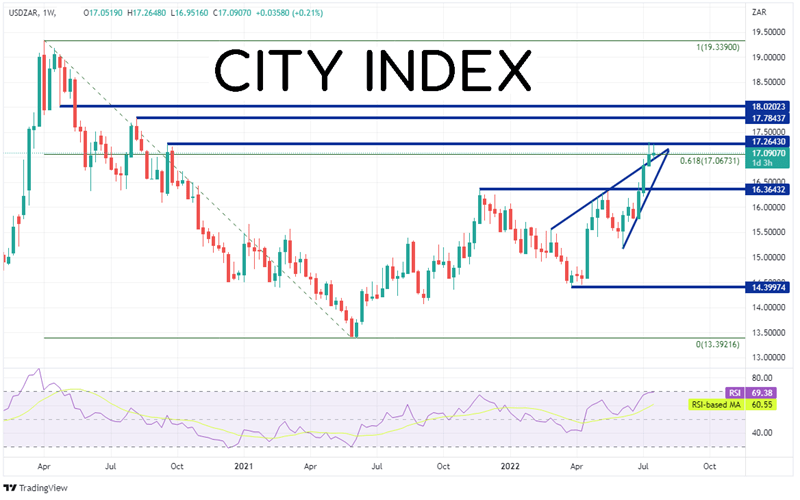
On a weekly timeframe, USD/ZAR has been on quite a tear since putting in a low of in 13.3713 in July 2021. The pair has recently traded as high as 17.3035. However, it ran into a strong confluence of resistance at previous highs from September 21st, 2020 and the 61.8% Fibonacci retracement level from the highs of the week of April 6th,2020 to the lows of July 2021.
Source: Tradingview, Stone X
Trade USD/ZAR now: Login or Open a new account!
• Open an account in the UK
• Open an account in Australia
• Open an account in Singapore
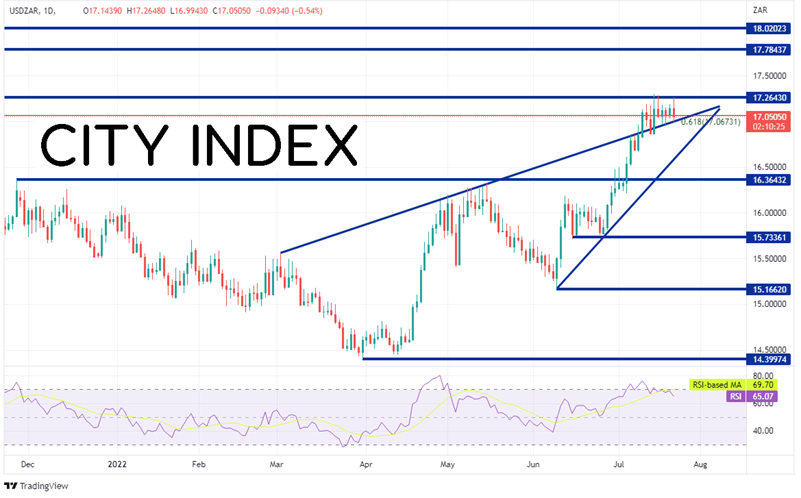
On a shorter-term daily timeframe, we can see that USD/ZAR is just above the top upward sloping trendline of an ascending wedge that the pair has been in since early June. If USD/ZAR can break higher above the horizontal resistance, the next resistance isn’t until the highs from the week of September 21st, 2020, then resistance from the lows of April 2020 at 18.0202. However, if the resistance can hold and USD/ZAR pulls back into the ascending wedge, first support is at the bottom trendline of the wedge near 16.5743. The target for the break of an ascending wedge is a 100% retracement, or 14.3997. However, in order to get there, the pair must break below horizontal support dating back to November 2021 near 16.3643. Below there is additional horizontal support from June at 15.7336 and 15.1662.
Source: Tradingview, Stone X
Just as with many of its central bank peers, the SARB has been hiking rates. However, inflation continues to rise in South Africa and is well above the 6% cap, with the latest reading at 7.4% YoY. Will the increased pace of interest rate hikes help slow inflation?
Learn more about forex trading opportunities.
Latest market news
Today 11:14 AM
Today 08:28 AM
Yesterday 03:30 PM
Yesterday 01:23 PM
Latest Trade Ideas articles
Today 11:14 AM
Yesterday 11:00 AM
Yesterday 08:15 AM