


Markets don’t always trend, so being able to trade rangebound markets is key to success. Discover what range trading is, and the best indicators to use in range trading strategies.
What is range trading?
Range trading is the strategy of finding entry and exit points within consolidating markets – that is, a market that’s constantly trading between two known lines of support and resistance.
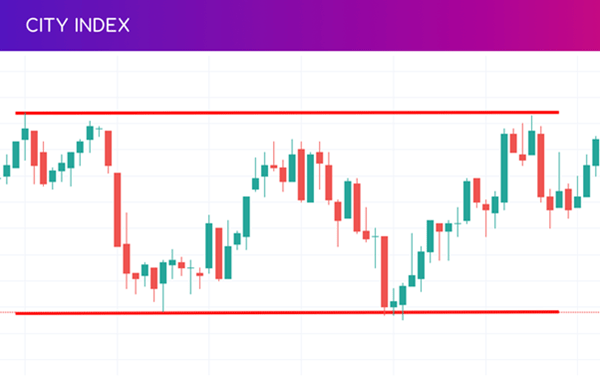
The most common way of establishing whether a market is rangebound or trending is by drawing trend lines between highs, and lows. If there are continually higher highs or lower lows, so that the trendlines slope up or down, you’d be looking at a trending market.
But in a rangebound market, the trendlines would appear flatter, as the highs are similar levels and so are the lows. Like so:
If you wanted to take a long position, you’d enter the market near a known level of support and exit near a known level of resistance. The opposite would be true for a short position.
A lot of traders will automate this, adding buy orders near support levels and sell orders near resistance levels.
Why is range trading popular?
Range trading strategies are popular because markets actually only trend – moving in a single, strong direction – a fraction of the time. Most activity is found in a range, so it’s an essential skill to be able to find opportunities in any sideways price action.
Range trading is used most by those that subscribe to short-term styles of trading, such as scalping and day trading. That’s because it’s focused on taking quick positions in the movement between two levels, rather than a long-term trend.
It’s also a common strategy for forex traders, who look to take advantage of the small and fast price changes in exchange rates.
What is a trading range breakout?
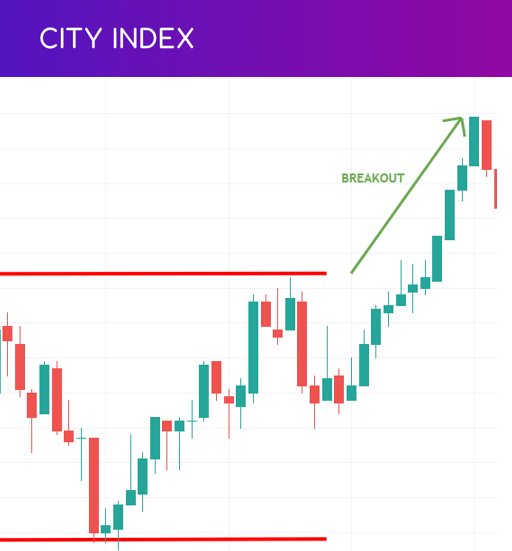
A trading range breakout occurs when momentum builds up and the market is able to push through those support and resistance levels.
Breakouts are typically used in trend trading, but even in a rangebound market, it’s absolutely vital to understand where prices are going to break out from support or resistance levels.
Not only can this enable traders to take advantage of a new strong trend with trend-following strategies, but it provides a clear exit point for any positions currently open.
Placing a stop loss at or immediately after a support or resistance level can help to minimise losses if a breakout occurs.
Range trading strategies
Most range trading strategies are based on technical indicators that provide overbought and oversold signals, giving guidance on when market sentiment might turn.
The most commonly used tools are pivot points, oscillators, volume and volatility indicators.
Pivot points
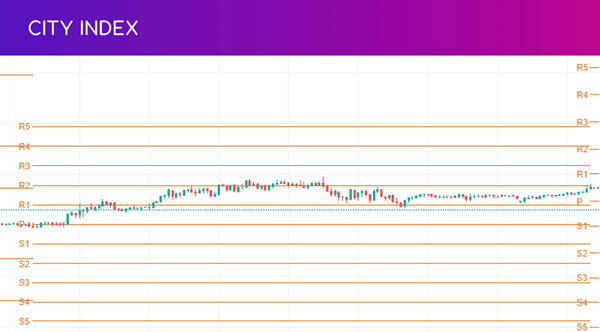
Pivot points are an indicator based on mathematical calculations for the average intraday high and low, and the closing price of the previous day. These lines are then mapped out on the subsequent trading day, as a way of projecting support and resistance levels.
Pivot points can be personalised, but usually, your trading platform will automatically add the standard seven lines, which are:
- P – the reference line
- S lines – that show different support levels
- R lines – that show different resistance levels
The idea is that these lines can inform traders where previous exhaustion points were and might still be. So, they can use the lines to find ideal entry and exit points.
For example, in this trading range, you might go long at R1 and close the trade at R2, or go short at R2 and close the trade at R1.
Relative strength index (RSI)
Range traders commonly use the relative strength index (RSI) alongside pivot points as a way of confirming overbought and oversold signals – in other words, levels at which the market is likely to reverse.
The RSI compares the average gains a market made on days when it closed up to losses made on days it closes down. It then plots this as a number between 0-100.
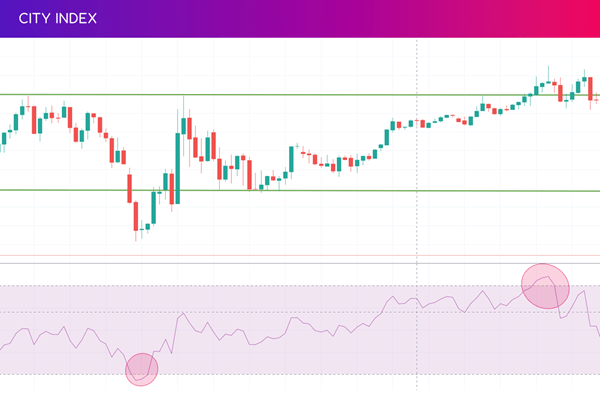
If the RSI reading is below 20 and rising, then range traders can use this as a potential signal that a support level has been found and the market will rebound to start trading higher.
On the other hand, if the RSI has reached above 80 and then starts to fall, it suggests a resistance level has been found and the market could head lower.
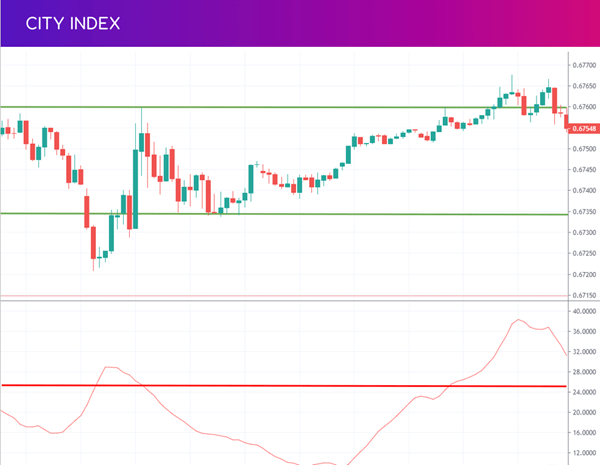
We can see on the following chart that each time the market jumps outside of the trend lines, the RSI also registers as overbought and oversold.
Alone, this might not tell a trader much – especially as markets can remain overbought and oversold for a long time – but with other indicators, it is a useful confirmation.
On-balance volume
Volume is a key component of range trading; it tells traders whether a given movement has any strength behind it or not. So, indicators that can help validate activity are extremely useful.
The theory is that volume precedes price, so if a new trend is forming then volume should increase in the direction of a trend.
For range traders, they’d be looking for volume to start decreasing before the price hits a support or resistance level, and then increase again once it’s bounced off in the other direction.
If the indicator shows that volume is still increasing at a support or resistance line, it’s more likely the level will be breached, and a breakout will occur. If the price levels are broken with low volume, it’s likely this is a false breakout, and the range will continue.
Average directional index (ADX)
The average directional index (ADX) is a single line that appears below a chart. It calculates recent price action to give traders an insight into the strength of a market’s current trend.
This can be useful for range traders looking to assess whether a new trend is strong enough to break out from a known support or resistance level.
The higher the ADX line, the stronger the current trend is. Anything above 25 is seen as a strong trend, whereas anything below 20 is seen as a weak or non-existent trend.
How to range trade
To start range trading with City Index, follow these steps:
- Open your City Index account and add some funds
- Log in to our award-winning Web Trader platform or download our mobile trading app
- Look out for a range-bound market on industry-leading TradingView charts
- Choose to ‘buy’ to go long, or ‘sell’ to go short
Alternatively, you can buy and sell our full selection of stocks, indices, forex, commodities and more with a City Index demo account.
This is a great option for new traders who want to practice range trading first without putting up any capital – instead, you’ll be trading with virtual funds and zero-risk.
Range trading stocks
Although the stock market broadly trends upward over the long term, securities regularly trade in a range over the short term – including stocks, bonds, funds and ETFs.
Range trading stocks is considered a more active strategy than trend trading because it capitalises on very short-term movements than just entering and holding a position.
Range trading currency pairs
Range trading is a popular forex trading strategy because a lot of currency pairs regularly trade between known highs and lows. So, buying near the low price, or selling near the high, means the forex trader can take small but regular profits.
The most popular currency pairs for rangebound strategies are currency crosses – those that do not include the US dollar. The most well-known range-bound currency is the EUR/CHF, which typically trades in a range due to the stability of the growth rate and exchange rate between the EU and Switzerland. Another would be the AUD/NZD pair, given the geographical proximity between Australia and New Zealand, and the similarity of their economic make-ups.
Latest market news
Yesterday 01:23 PM
Yesterday 06:01 AM
April 18, 2024 11:27 PM
April 18, 2024 04:46 PM
Latest Insights articles
March 21, 2024 04:05 AM
February 12, 2024 02:44 PM
February 9, 2024 04:37 PM
February 8, 2024 06:25 PM