


August 26, 2022 1:51 AM
The second look at the GDP usually doesn’t mean a lot to the markets as the data is already months old. But for the second look at the Q2 GDP for 2022, this time it may matter to the markets before Fed Chairman Powell gives his speech tomorrow at the Jackson Hole Symposium. The preliminary estimate for Q2 GDP, released a month ago, showed that the economy shrank by -0.8% vs a Q1 reading of -1.6%. Two quarters of consecutive negative growth means that the economy is in a “technical recession”. Although the revision to -0.6% doesn’t change that, it does show that the economy was not as weak as initially indicated in Q2. However, the more important piece of the revised data from the revised GDP report is the GDP Price Index. The price index was revised higher from a preliminary estimate of 8.7% to 9% vs a Q1 reading of 8.3%. This shows that inflation during Q2 was 0.3% higher than initially expected. Why does this matter? It continues to shed light on the fact that Fed underestimated inflation over the course of the last year and now is faced with an aggressive pace of tightening. Fed Chairman Powell will have some explaining to do when he speaks tomorrow regarding the big miss in the Fed’s inflation estimates and the current pace of rate hikes. See our complete Jackson Hole Preview here.
Everything you need to know about the Federal Reserve
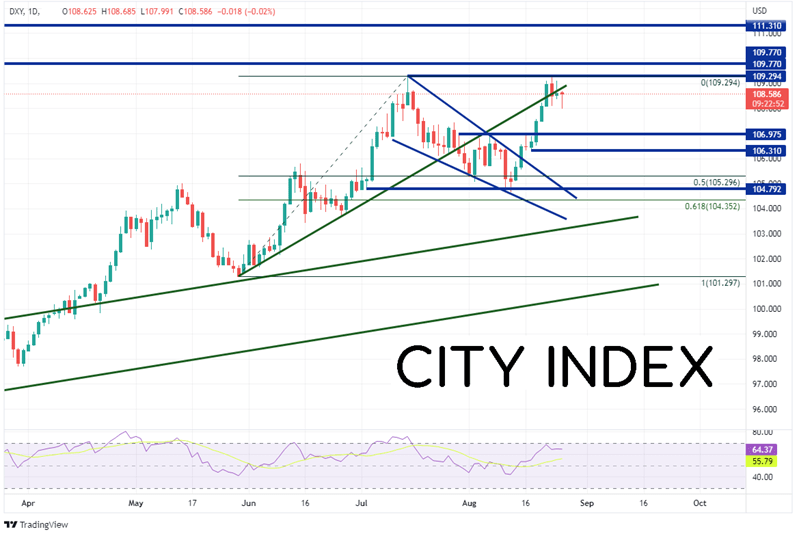
The US Dollar Index (DXY) has been moving aggressively higher since breaking above an upward sloping channel on April 14th, near 100.00. After retesting the trendline on May 30th, the DXY moved to a 20 year high on July 14th at 109.29. It then pulled back in a descending wedge formation and traded to horizontal support, just below the 50% retracement from the lows of May 30th to the highs of July 14th at 104.65. Two days later, the Dollar Index broke out of the descending trendline near 106 and hasn’t looked back. On Tuesday, the pair tested the July 14th highs and held, but has been holding near recent levels as price waits for Powell’s speech tomorrow.
Source: Tradingview, Stone X
Trade DXY now: Login or Open a new account!
• Open an account in the UK
• Open an account in Australia
• Open an account in Singapore
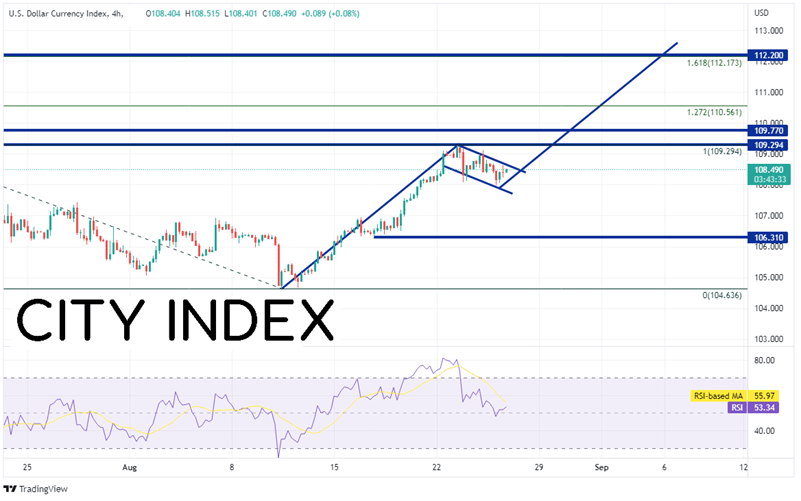
On a 240-minute timeframe, the recent move higher in the DXY followed by consolidation ahead of the prior highs and Fed Chairman Powell’s speech tomorrow, has led to a potential flag pattern. If price doesn’t break higher out of the pattern, the target is the length of the flagpole added to the breakout point, which in this case is near 112.60. However, price must first get through resistance at the previous highs of 109.29, then horizontal resistance from the highs of September 2002 at 109.77. Above there, the next level of resistance isn’t until the 127.2% Fibonacci extension from the highs of July 14th to the lows of August 10th at 110.56. However, if the resistance holds, the first level of support is at the bottom trendline of the flag pattern near 107.99. Below there, price can fall to the lows of August 16th at 106.31, then the lows of August 10th at 104.64.
Source: Tradingview, Stone X
Even though the GDP data for Q2 is old, the revisions higher, especially to the GDP price index, may mean something to Fed Chairman Powell when he speaks at the Jackson Hole Symposium. Traders are cautious ahead of the meeting. But watch for volatility in the US Dollar Index over Powell begins to speak!
Learn more about forex trading opportunities.
Latest market news
Today 08:15 AM
Today 05:45 AM
Yesterday 11:09 PM
Latest Trade Ideas articles

Today 08:15 AM

Today 05:45 AM