


Nvidia shares rose 2.7% during after-market trade thanks to strong data-centre demand helping them beat analysts Q3 revenue expectations. Earlier in the day they also announced a partnership with Microsoft to build an AI super computer. However, their EPS (earnings per share) was a miss and Q4 revenue guidance was also slightly lower than expected.
Nvidia (NVDA): Bear market rally or new bullish trend?
The tech stock peaked in November 2021 at 346.47 and managed to fall nearly 70% over the next 11 months, so its bear trend is more than established. Yet in the past month it has recovered an impressive 57.2%, and that makes us wonder whether this is the beginning of a much larger bull trend, or simply a tease of a bear-market bounce.
I’m happy to let the longer-term investors argue that one over, but I do know that we’re heading into 2023 with a Republican House and Democrat Senate, which means we’re less likely to see inflationary policies make their way over the line (good news to equity traders). But we’re also likely to be seeing much lower growth in 2023 and 2024, and cracks are appearing in the US employment sector data – and many big tech companies have announced layoffs or restructuring plans.
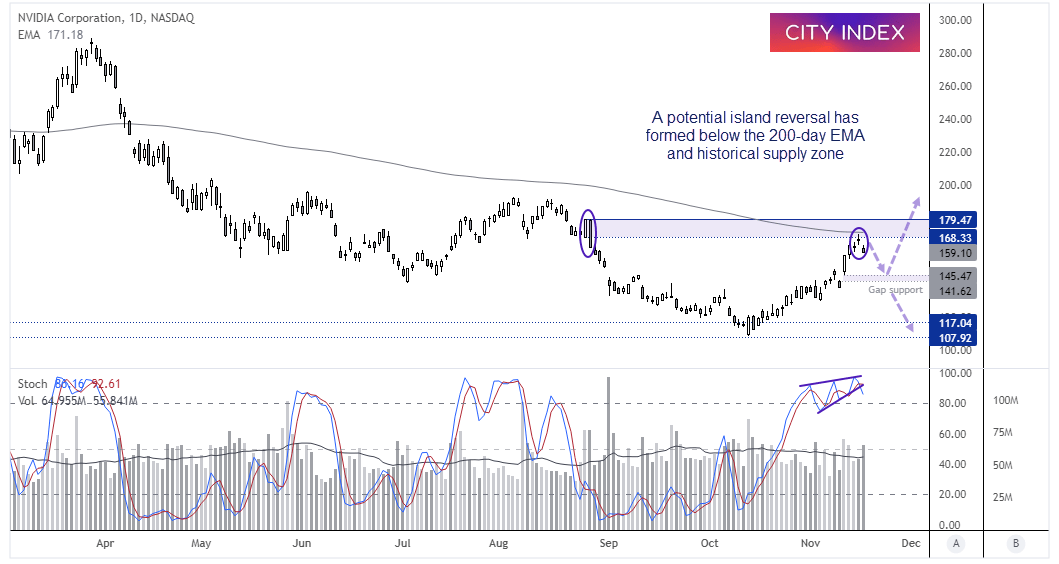
NVIDIA daily chart:
From a technical perspective, I suspect NVIDIA has posted a cycle top. Its rally stalled just below the 200-day EMA, which is a tough mut to crack. A small Doji formed at the cycle high, which is part of a 3-bar reversal called an Island reversal pattern. Furthermore, the reversal pattern is just beneath the prior peak which included a strong 2-bar reversal (and therefore a strong supply zone). Volume was also above average yesterday ahead of earnings and the stochastic oscillator is overbought, which itself is showing signs that it also wants to top out.
- The stock rallied over 2% during after-market hours, but that could allows bears to short at a more favourable prices (assuming resistance holds).
- Bears could enter short below the 200-day EMA with a stop above the 179.47 high.
- Gap support around 141.62 – 145.47 makes a viable downside target which can be trailed along the way.
- As price action unfolds, we may have a better idea as to whether it is a retracement against a much larger bullish move, or the market has returned to the long-term bear trend.
How to trade with City Index
You can easily trade with City Index by using these four easy steps:
-
Open an account, or log in if you’re already a customer
• Open an account in the UK
• Open an account in Australia
• Open an account in Singapore
- Search for the company you want to trade in our award-winning platform
- Choose your position and size, and your stop and limit levels
- Place the trade
Latest market news
Yesterday 01:23 PM
Yesterday 06:01 AM
April 18, 2024 11:27 PM
Latest Trade Ideas articles

April 18, 2024 11:27 PM
April 18, 2024 04:46 PM