


November 5, 2022 2:24 AM
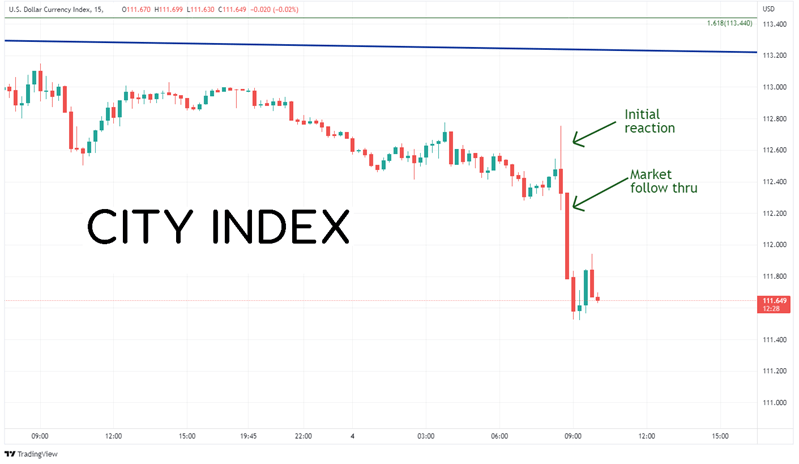
US Non-farm Payrolls for October were stronger than anticipated at +261,000 vs an expectation of +200,000 and a previous reading of +315,000. The Unemployment Rate rose from 3.5% to 3.7%, while the participation rate fell to 62.2% vs 63.3% previously. In addition, Average Hourly Earnings rose to 0.4% from 0.3%. Today’s employment data continues to fulfill the “maximum sustainable employment” side of the Fed’s dual mandate. This should continue to give the Fed the confidence it needs to try and get a hold of the “price stability” part of the mandate. Fed Chairman Jerome Powell has said that wage growth needs to continue to increase with inflation. However, he also noted that it must not rise too quickly. If it does, “you’re in trouble.”
The US Dollar Index had an initial bounce as the data was released on the back of the stronger than expected results (good data means more rate hikes, so USD goes higher). However, within just a few seconds the DXY pulled back as traders realized that the data won’t affect the Fed’s overall view. The Fed statement read that “in determining the pace of rate hikes, we will consider the cumulative tightening, policy lags, and economic and financial developments”. The jobs report does little to change the narrative, therefore although the Fed may be looking for higher terminal rates, “slowing the pace of rate increases” is what markets are focusing on right now.
Source: Tradingview, Stone X
Trade the DXY now: Login or Open a new account!
• Open an account in the UK
• Open an account in Australia
• Open an account in Singapore
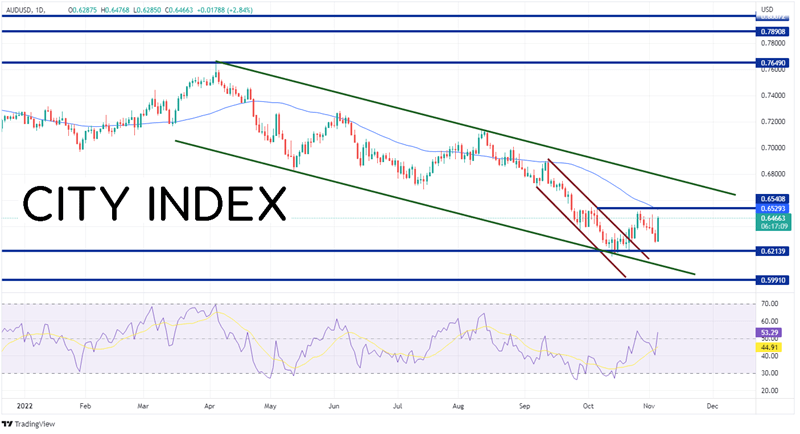
With the inconsequential Non-Farm payroll data, combined with news out of China that it is loosening some of its Covid restrictions, the antipodean currencies are getting a bid. At the time of this writing, AUD/USD is up nearly 3% on the day. The pair has been moving lower in a descending channel since April 5th when price was near 0.7650. AUD/USD still trades in that downward sloping channel today.
Source: Tradingview, Stone X
Trade AUD/USD now: Login or Open a new account!
• Open an account in the UK
• Open an account in Australia
• Open an account in Singapore
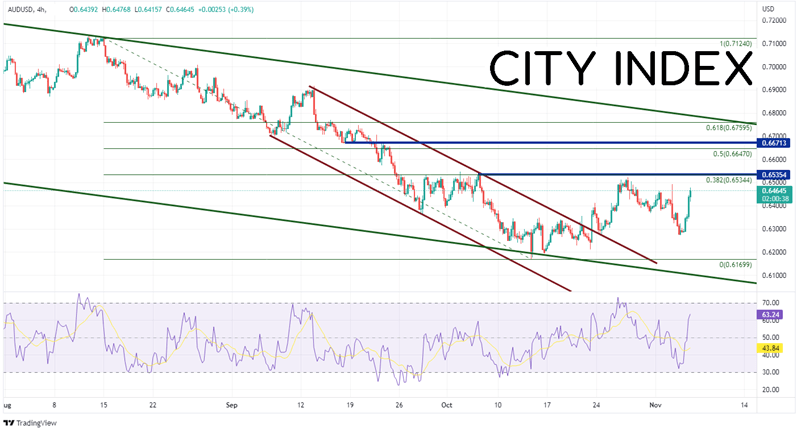
On a shorter 240-minute timeframe, AUD/USD has recently traded sideways out of a shorter descending channel and the pair may be beginning to change direction. AUD/USD is approaching a confluence of resistance at the highs of October 22nd, the 38.2% Fibonacci retracement from the highs of August 15th to the lows of October 13th, and the 50 Day Moving Average (see daily) between 0.6529 and 0.6540. If price breaks above there, the next resistance is the 50% retracement from the same timeframe at 0.6647 and then horizontal resistance at 0.6671. However, if the pair moves lower, the first support level is at the November 3rd lows of 0.6272, then the lows from October 13th at 0.6170. If it continues lower from there, the bottom trendline of the long-term channel crosses near 0.6100.
Source: Tradingview, Stone X
With the stronger than expected payroll data, the Fed can continue to do as it pleases regarding “price stability”. Part of that may be only hiking by 50bps at the December meeting. Combine that with news that China may be loosening Covid restrictions, and AUD/USD is bid. Watch the CPI data next week to get a better idea as to if the Fed will hike 50bps or 75bps at its December meeting!
Learn more about forex trading opportunities.
Latest market news
Today 01:15 PM
Today 11:30 AM
Today 08:18 AM