


February 12, 2022 4:00 AM
The preliminary reading for the February Michigan Consumer Sentiment was 61.7 vs an expectation of 67.5 and a January reading of 67.2. This was the lowest reading since October 2011! Most of the miss was due to the Current Conditions component, which was 68.5 vs 73 expected and 72 in January. This was the lowest reading since August 2011! Despite these low numbers, it wasn’t the headline number that traders were interested in; it was the inflation component! The 1-year inflation expectation was 5% vs 4.9% expected and 4.9% last. This was the highest reading since November 2011. This means that in 1 year, consumers still believe that inflation will be around 5%. In addition, the 5-year inflation expectation was 3.1%! Note that the Fed’s target for inflation is only 2%, yet consumers believe that inflation will be 3.1% in 5 years. This will do little to help back the Fed’s case for small, incremental increases in interest rates over the next year, as assumed. The Fed has their work cut out for them to help lower inflation expectations.
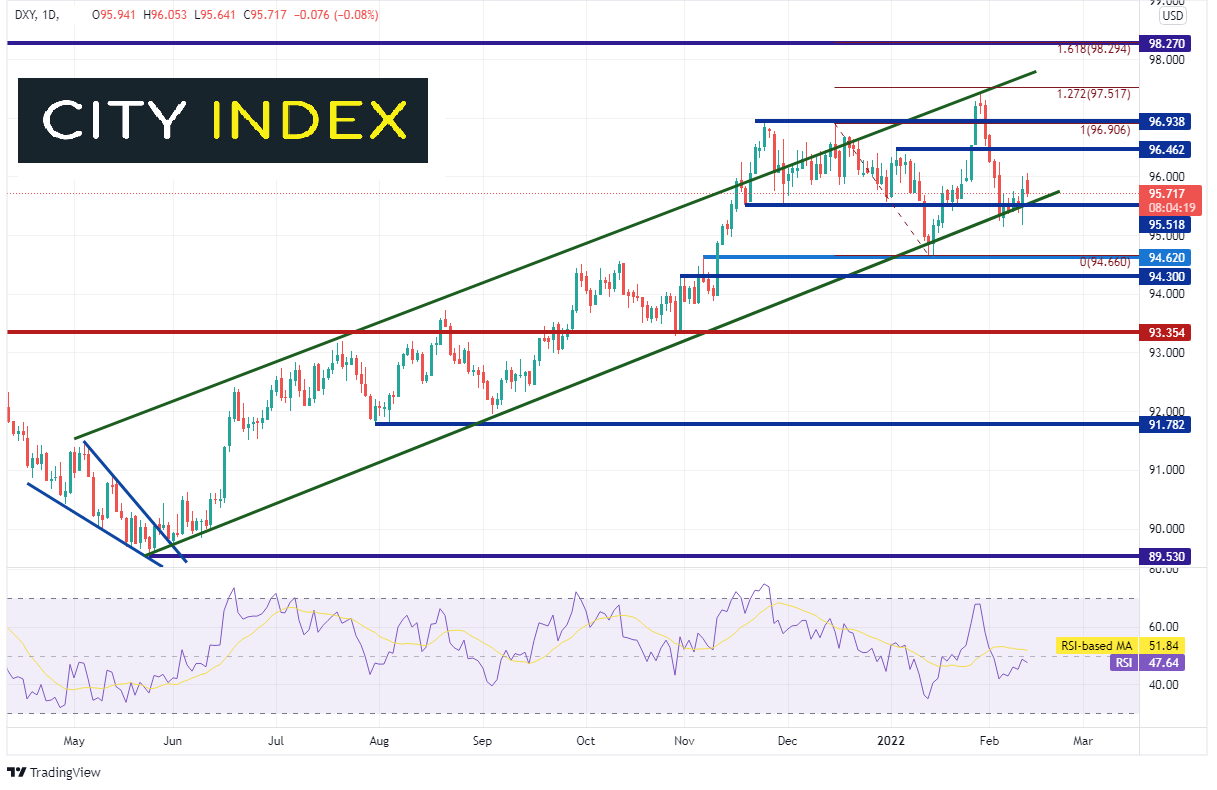
The US Dollar Index has been moving higher in a channel since May 2021. Price briefly broke out to the topside of the channel in November 2021 and reached a high of 98.91, only to trade back inside the channel and test the bottom side on January 12th, near 94.66. The DXY moved higher once again to the 127.2% Fibonacci extension from those November 2021 highs to the January 12th lows near 95.54. That level also acts as resistance at the top of channel trendline. Price formed an Evening Star formation and moved lower back to the bottom trendline of channel. The DXY is currently sitting just above the trendline, which crosses near 95.50.
Source: Tradingview, Stone X
Trade DXY now: Login or Open a new account!
• Open an account in the UK
• Open an account in Australia
• Open an account in Singapore
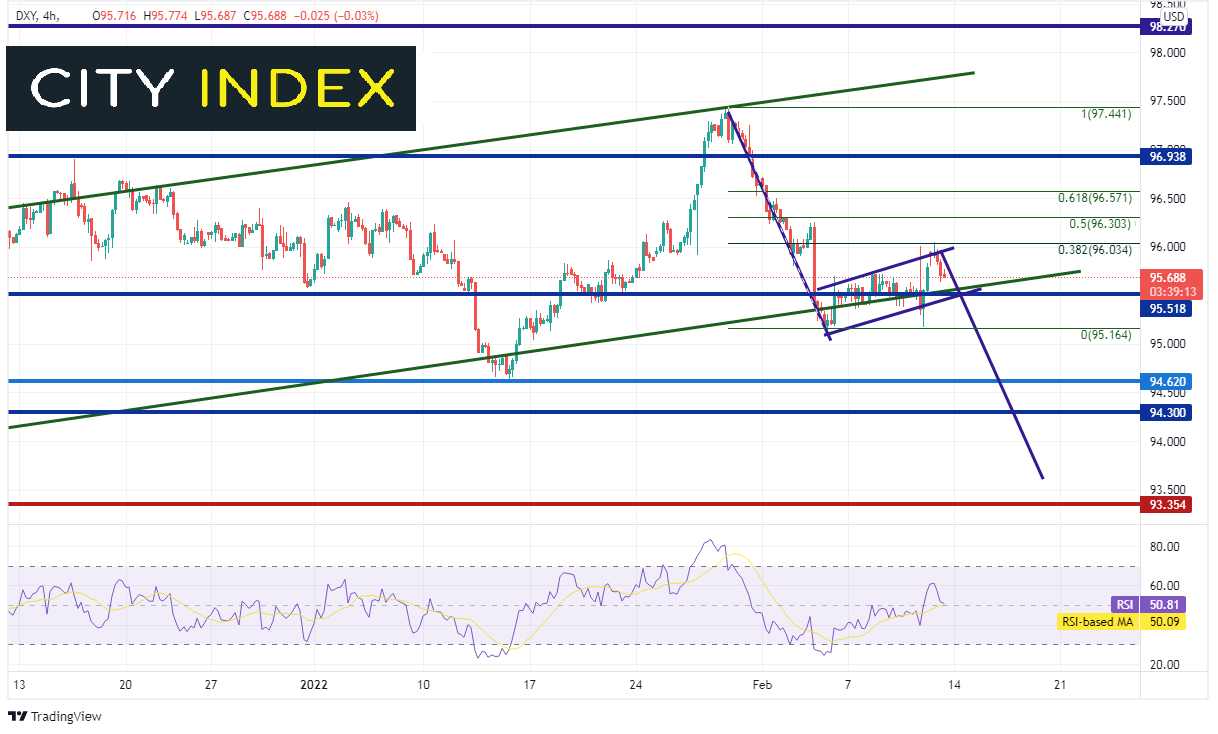
On a 240-minute timeframe, DXY is flagging at the channel trendline support level. Price bounced to the 38.2% Fibonacci retracement level from the highs of January 28th to the lows of February 3rd, near 96.03. If price breaks below the confluence of support at 95.50, the next level of support is at the February 4th lows near 95.13. Below there, price can fall to the January 14th lows of 94.62 and then horizontal support at 94.30. The target for the flag pattern is the length of the flag “pole” added to the breakdown point. In this case, it is near 93.60.
Source: Tradingview, Stone X
Thanks to the recent selloff, there are several resistance levels before the January 28th highs at 97.44. Immediate resistance is at today’s high of 96.05, then the 50% retracement level and the 61.8% Fibonacci retracement levels from the January 28th highs to the February 4th lows at 96.30 and 96.57, respectively. Above there is horizontal resistance at 96.94.
The next move in the DXY is going to depend on when, and by how much, markets think the Fed will move in interest rates. The headline Michigan Consumer sentiment data was horrible. However, traders are looking more at the inflation data than the headline data. If inflation expectations continue to be strong, it may present the Fed with the opportunity to hike 50bps in March, rather than 25bps!
Learn more about forex trading opportunities.