


January 25, 2023 3:43 AM
Mexico is one of the few countries that releases its CPI data twice a month. As a result, the final print isn’t as exciting as other countries that release CPI once a month. In Mexico’s case, the mid-month CPI is often a bigger deal than the final reading. Earlier today, Mexico released its mid-month CPI for January. The headline reading increased to 7.94% YoY vs an expectation of 7.86% YoY and a December reading of 7.77% YoY. This is the first increase in headline inflation since September 2022. In addition, the mid-month Core CPI rose to 8.45% YoY vs and expectation of 8.34% YoY and a prior reading of 8.35% YoY. The Bank of Mexico (Banxico) has been in lockstep with the Fed in raising rates since June, when the Fed raised rates by 75bps. In December, the Fed only raised rates by 50bps, and so did Banxico. The FOMC meets next week to decide how much to raise interest rates. The expectation is only for an increase of 25bps, primarily due to inflation increasing at its slowest pace since October 2021 at 5.7% YoY. Banxico meets on February 9th at its next Interest Rate Decision Meeting, the same day as the January final CPI reading. If inflation remains elevated or increases further, will the central bank continue to follow in the steps of the Fed and only raise rates by 25bps? Note that Mexico’s benchmark rate already stands at 10.5%. How much further is Banxico willing to raise rates to slow inflation?
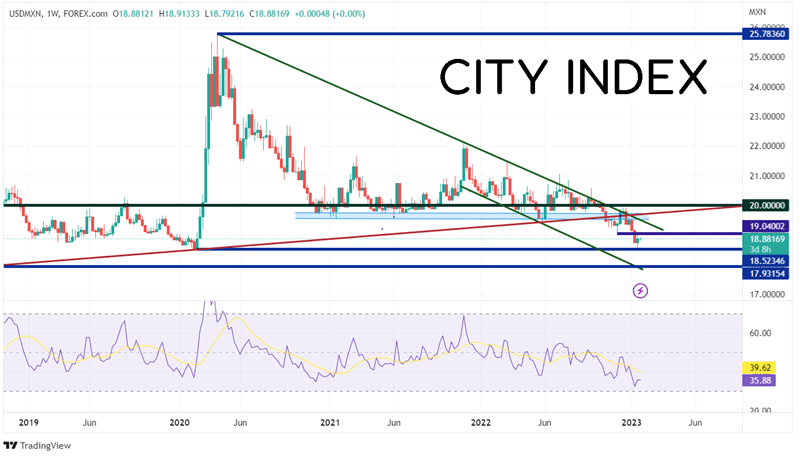
On a weekly timeframe, USD/MXN has been moving lower in a descending triangle since making pandemic highs at 25.7836 during the week of April 6th, 2020. The pair formed a support zone between 19.5491 and 19.7322 from December 2020 until November 2022. During that time, USD/MXN traded to the top trendline of the triangle, but was rejected each time and returned to the support zone. During the first week of 2023, the pair convincingly broke below the support zone and a trendline dating to 2017 (red) and hasn’t looked back since.
Source: Tradingview, Stone X
Trade USD/MXN now: Login or Open a new account!
• Open an account in the UK
• Open an account in Australia
• Open an account in Singapore
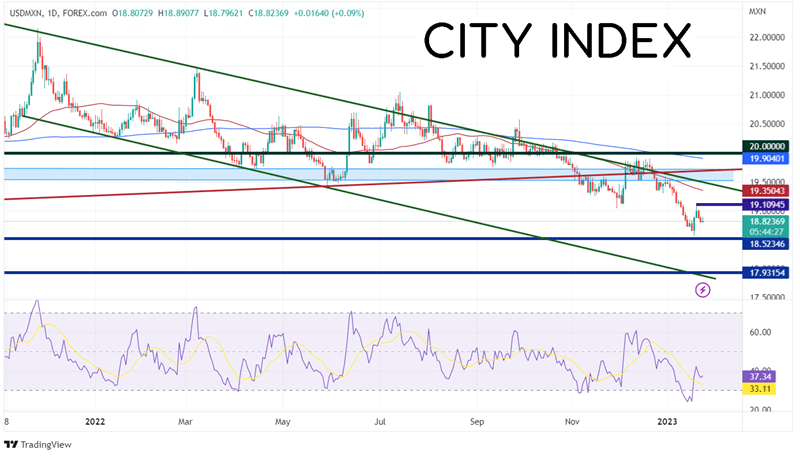
On a daily timeframe, USD/MXN broke below its November 29th lows at 19.0225 on January 11th and almost reached its pre-pandemic low at 18.5235 on January 17th. However, the pair bounced just above the previous lows and is currently trading between the January 18th lows and the January 19th highs. First horizontal resistance is at 19.1095. Above there, USD/MXN can move to the 50 Day Moving Average at 19.3504 and then a confluence of resistance at the top, downward sloping trendline of the channel and the resistance zone near 19.5200. However, if price continues to move lower, the first support is the lows from February 2020 at 18.5235. Below there, USD/MXN can fall to a confluence of support at the bottom trendline of the downward sloping channel and the lows from April 2018 near 17.9315.
Source: Tradingview, Stone X
Mid-month inflation data for January showed that CPI has increased in Mexico. Meanwhile, the US inflation data is decreasing. If the Fed hikes 25bps as expected on February 1st, will Banxico continue to match the Fed’s rate hikes and only raise rates by 25bps as well? Banxico meets on February 9th.
Learn more about forex trading opportunities.
Latest market news
Yesterday 11:09 PM
Yesterday 11:01 PM
Yesterday 04:00 PM
Yesterday 01:15 PM
Yesterday 11:30 AM
Yesterday 08:18 AM
Latest Forex articles
Yesterday 11:09 PM
Yesterday 04:00 PM
Yesterday 04:19 AM
April 22, 2024 04:33 PM