


January 31, 2023 7:14 AM
This week brings with it a few big-name central bank meetings that you may have already heard about. On Wednesday, the FOMC meets and is expected to hike 25bps. On Thursday, the BOE meets and is expected to hike 50bps. Also on Thursday, the ECB meets and is expected to hike rates by 50bps. These are all strong convictions in the market, therefore, any sway from these expectations could cause extreme volatility in the US Dollar, the British Pound, or the Euro. In addition, traders will be watching the respective statements and press conferences for hints as to what each central bank may do at its next meeting. This could also cause a good deal of volatility in the fx markets.
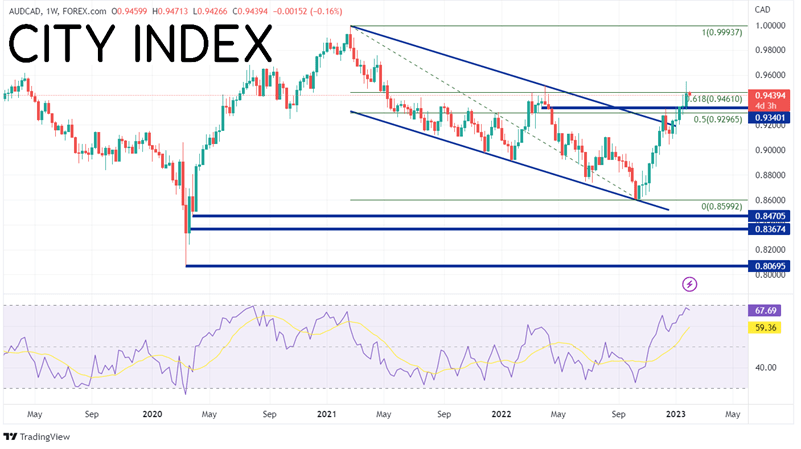
Are you looking to stay away from the above-mentioned currencies? Why not look at AUD/CAD? The RBA doesn’t meet until February 7th, and the Bank of Canada met last week. Therefore, the pair may not be as volatile as USD, GBP, and EUR pairs. On a weekly timeframe, AUD/CAD had been trading in an orderly downward sloping channel since its post pandemic high in February 2021 at 0.9994. During October 2022, the pair reached a low of 0.8599 as it bounced off the bottom trendline of the channel. Since then, AUD/CAD has been moving higher. In early December 2022, the pair briefly broke above the top trendline of the channel but was halted at the 50% retracement from the February 2021 highs to the October 2022 lows near 0.9297. The pair pulled back briefly to 0.9043, however since the week of December 19th, 2022 the pair has been moving aggressively higher. Last week the pair moved above the 61.8% Fibonacci retracement at 0.9461 and has been trading near that level since.
Source: Tradingview, Stone X
Trade AUD/CAD now: Login or Open a new account!
• Open an account in the UK
• Open an account in Australia
• Open an account in Singapore
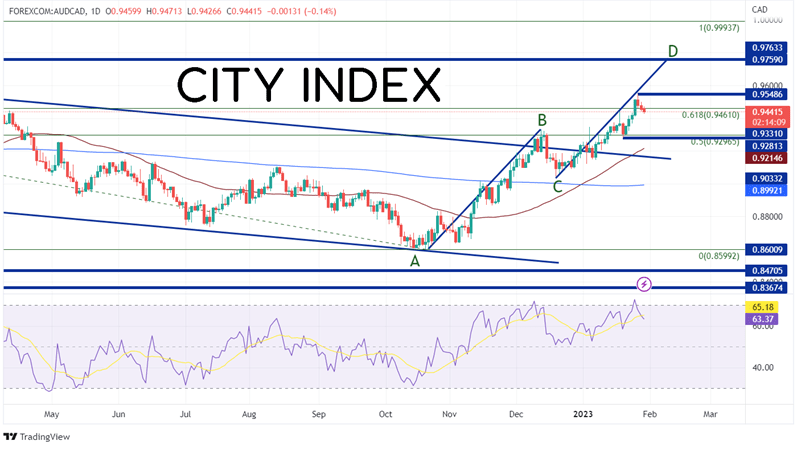
On a daily timeframe, as AUD/CAD moved off the lows of October, it formed an AB=CD pattern, in which the move in price of AB should equal the move in price of CD. If price continues to move towards the target, it must first pass through resistance at the January 26th highs of 0.9549. Above there, price can move to the target and horizonal resistance dating to the highs of April 2021 at 0.9759. There is little resistance after that until the February 2021 highs at 0.9994. If price pulls back, the first support is at the lows from January 19th at 0.9281. Below there, AUD/CAD can fall to the 50 Day Moving Average at 0.9215, then the top, trendline of the previous channel near 0.9170.
Source: Tradingview, Stone X
If traders are looking for a currency pair that may have less volatility this week than a pair with the US Dollar, the Pound, or the Euro, AUD/CAD may be a good candidate. Since October 2022 the pair has been moving higher and has recently pulled back after reaching the 61.8% Fibonacci retracement level from the highs of February 2021 to the lows of October 2022. Watch to see if AUD/CAD can continue higher and reach the AB=CD target at 0.9749.
Learn more about forex trading opportunities.
Latest market news
Today 01:15 PM
Today 07:49 AM
Today 04:24 AM
Latest Forex articles

Today 04:24 AM
Yesterday 10:48 PM
Yesterday 12:00 PM