


February 16, 2023 4:24 AM
When the NAS100/RUT ratio is increasing, it shows that the NASDAQ 100 (large caps) are rising faster (or falling slower) than the Russell 2000 (small caps). This is a sign that the investors believe the market is slowing down and it is better to be in large cap stocks than small caps. As the economy begins to slow, markets expect interest rates to fall as growth slows. If the NAS100/RUT is falling, it shows that the NASDAQ 100 is falling faster (or rising slower) than the Russell 2000. This would be a sign that the economy may be picking up and it is better to be in small caps rather than large caps. As the economy grows, markets expect interest rates to rise as the pace of growth accelerates.
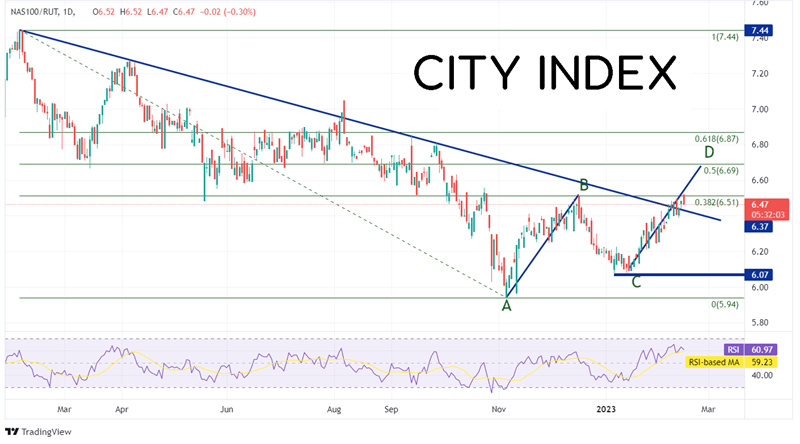
On a daily timeframe, the NASDAQ 100 / Russell 2000 ratio has been moving lower since early February 2022, when it was near 7.44, as markets expected the Fed to begin increasing interest rates. Although higher interest rates are worse for everyone, small businesses are likely to do well as growth picks up. The key ratio continued to fall until November 4th, 2022, when it bottomed at 5.94, and bounced. The key ratio rose to the 38.2% Fibonacci retracement from the February 2022 highs to the November 2022 lows, near 6.51. The NAS100/RUT ratio pulled back to 6.07 in January 2023, setting up an AB=CD formation. Since then, the ratio has been on the rise, breaking above the downwards sloping channel dating to February 3rd, 2022, and is again retesting the 38.2% Fibonacci retracement level at 6.51. The target for the AB=CD patter is near the 50% retracement from the previously mentioned timeframe at 6.69.
Source: Tradingview, Stone X
Trade the NASDAQ 100 now: Login or Open a new account!
• Open an account in the UK
• Open an account in Australia
• Open an account in Singapore
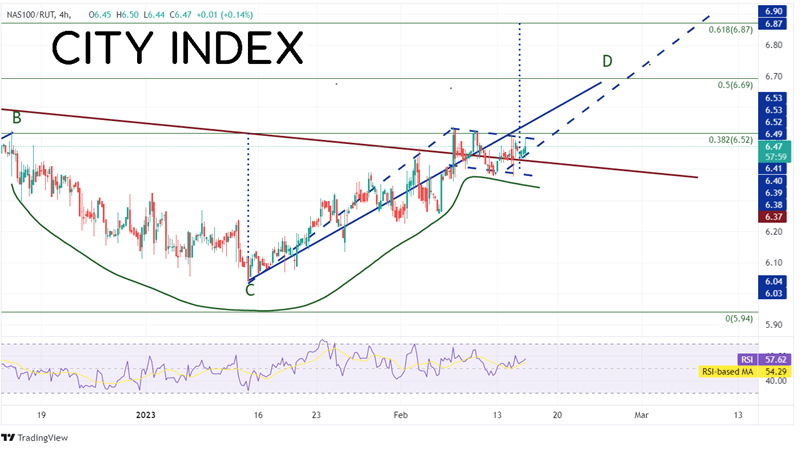
On a 240-minute timeframe, there is a lot to break down. First, one can better see the target for the AB-=CD pattern near the previously mentioned 50% retracement level at 6.69. In addition, the move from December 14th, 2022 (B) until now has formed a cup-and-handle formation. The NAS100/RUT is currently in the handle of the formation. The target is equal to the height of the pattern added to the breakout point from the handle, or near 6.87. This level is also the 61.8% Fibonacci retracement level from the February 3rd highs to the January 13th lows. Also, the ratio has formed a flag pattern as it consolidates near the prior high and the recently mentioned 38.2% Fibonacci retracement level. The target is the length of the flagpole added to the breakout point, which is also near 6.87.
Source: Tradingview, Stone X
Trade the Russell 2000 now: Login or Open a new account!
• Open an account in the UK
• Open an account in Australia
• Open an account in Singapore
If one believes the NASDAQ 100 will outperform the Russell 2000 and chooses to take a trade in the ratio, the investor can buy the NASDAQ 100 and sell the Russell 2000. Resistance is at the previously mentioned 50% retracement level at 6.69 and the 61.8% Fibonacci retracement level at 6.89. However, if ones believes the NASDAQ 100 will underperform the Russell 2000 and chooses to take a trade in the ratio, the investor can sell the NASDAQ 100 and buy the Russell 2000. Support is at the bottom of the flag pattern near 6.38. Below there, the ratio can fall to the February 1st lows at 6.22 and then the lows from January 25th at 6.13. (Support levels are not shown for clarity on the chart above).
The NAS100/RUT ratio is a simple way to determine if large caps are outperforming small caps. If the ratio is rising, the NASDAQ 100 is outperforming. If the ratio is falling, the Russell 2000 is outperforming. Watch the ratio to determine who the next market leaders will be.
Latest market news
Yesterday 01:23 PM
Yesterday 06:01 AM
April 18, 2024 11:27 PM
Latest Trade Ideas articles

April 18, 2024 11:27 PM
April 18, 2024 04:46 PM