


February 23, 2022 7:35 AM
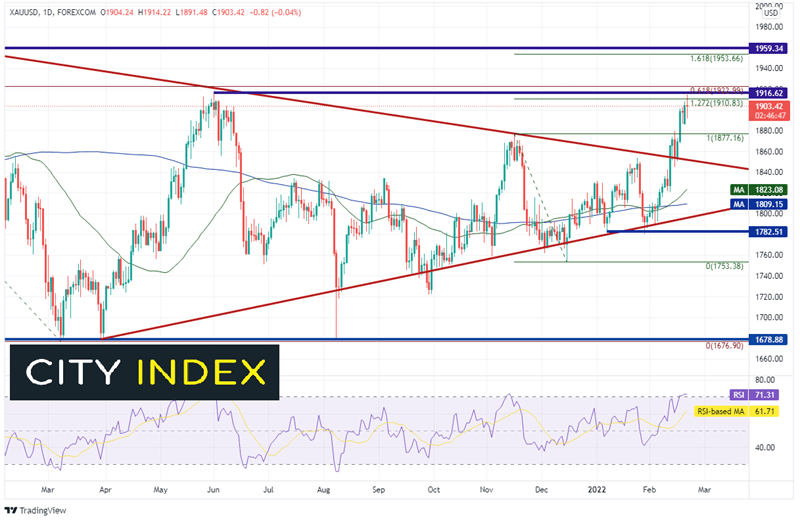
As Russia was building troops along the Ukraine border, Gold (XAU/USD) was nearing the apex of a long-term symmetrical triangle. Finally, on February 11th, as the “flight to safety” trade began in earnest, Gold broke out above the top, downward sloping trendline of the triangle. As we wrote about last week, price moved higher towards a large resistance area between 1910 and 1923. The resistance in this area is made up of the following;
- The 127.2% Fibonacci extension from the highs of November 16th, 2021 to the lows of December 15th, 2021
- Horizontal resistance from the highs of June 1st, 2021
- The 61.8% Fibonacci retracement from the all-time highs on August 7th, 2020 to the lows of March 8th, 2021.
Source: Tradingview, Stone X
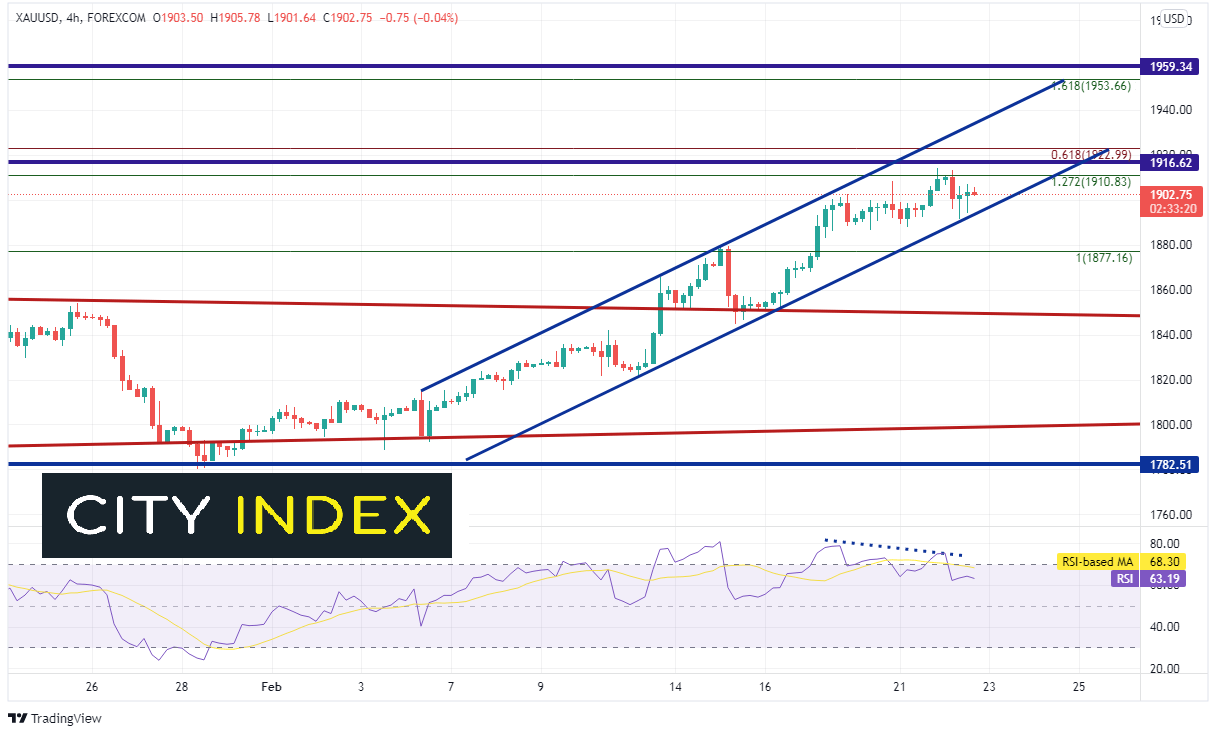
Not only was the move to this area precipitated by the fear of an invasion, but it was also due to rising inflation and sentiment. In particular, the most recent COT report which showed that managed funds most bullish on gold in 3 months. Today, the price of Gold traded as high as 1914.22 and was rejected. Does this mean that the Gold prices will move lower?
Source: Tradingview, Stone X
Trade Gold (XAU/USD) now: Login or Open a new account!
• Open an account in the UK
• Open an account in Australia
• Open an account in Singapore
Notice on the 240-minute timeframe that the RSI is diverging with price. If price does move lower, first support is at today’s lows near 1891.48 and then horizontal support near 1877.16. The top, downward sloping trendline of the long-term trendline (red) is the next support level near 1850. However, if price is able trade above 1923, the top trendline of the channel is the first level of resistance at 1934. Above there is a confluence of resistance at the 161.8% Fibonacci extension from the November 16th, 2021 highs to the December 15th, 2021 lows and horizontal resistance from the January 6th, 2021 highs between 1953.66 and 1959.34. The psychological round number resistance is just above there at 2000.
Russia has moved into Donetsk and Luhansk and some believe Putin is set to move further into Ukraine. Will that draw more ire from the West which will lead to war? That has yet to be determined. However, right now, with Gold sitting at a confluence of resistance, the RSI diverging with price, and managed funds extremely bullish the yellow metal, there may be a pullback before it resumes higher.
Learn more about metals trading opportunities.
Latest market news
Today 08:15 AM
Today 05:45 AM
Yesterday 11:09 PM
Yesterday 11:01 PM
Latest Trade Ideas articles
Today 08:15 AM

Today 05:45 AM
Yesterday 11:09 PM