


October 28, 2021 7:19 AM
According to our internal data, the Dow Jones Industrial Average (Dow) is our most widely traded stock index. Rather than trading individual a large cap stock, investors and traders can turn to the Dow Jones Industrial Average (the granddaddy of them all) to benefit from the top 30 most prominent companies on Wall Street. As there are only 30 stocks in the index, when news announcements or earnings are released, the index tends to move. However, the move for the index won’t be as large as the move in the individual stock itself. For example, Microsoft, McDonalds and Coca-Cola all released better than expected earnings either after Tuesday’s close or on Wednesday morning before the open. While the Dow opened marginally higher (0.02%), Microsoft opened nearly 2% higher (and is over 4.5% as of the time of this writing).
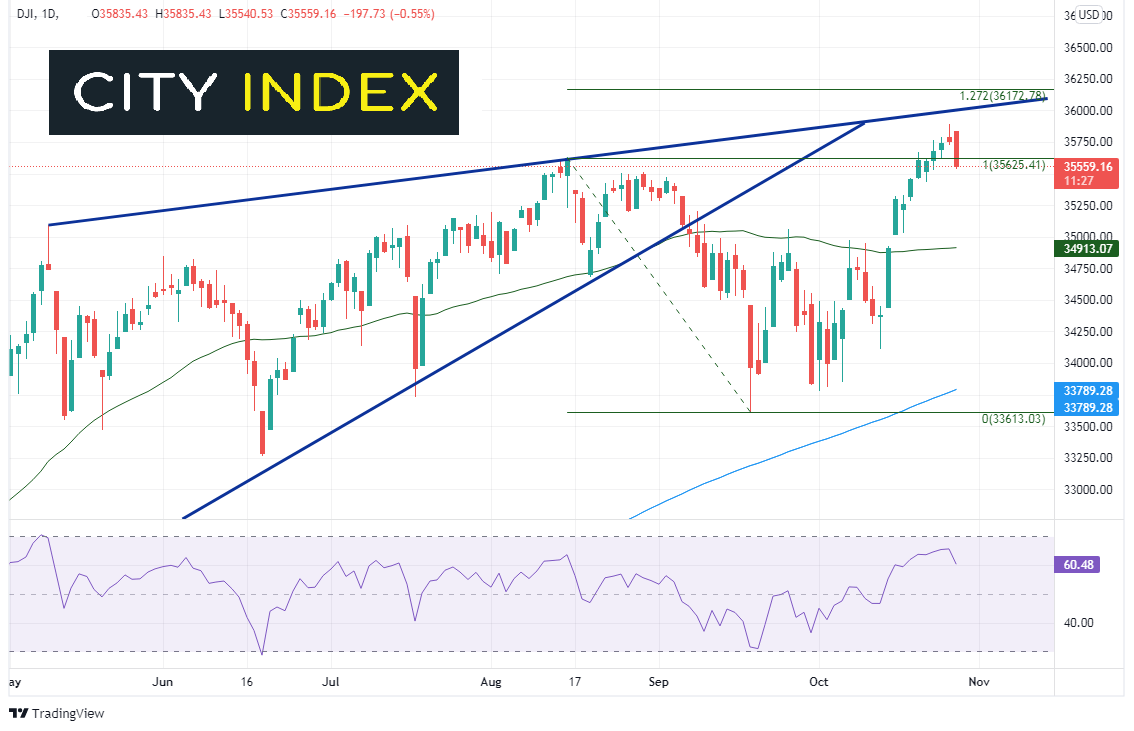
Prior to Tuesday, the Dow formed all-time new highs, and had closed higher than the previous day for 9 straight sessions. However, Tuesday’s shooting star candlestick signaled the Dow may pull back after the index gapped open higher on Wednesday. That is indeed what happened, as Wednesday’s candlestick formed a bearish engulfing pattern, in which the real body of Wednesday’s candle engulfed the real body of Tuesday’s candle. The Dow is currently trading below previous all-time highs from August 16th.
Source: Tradingview, Stone X
Trade the Dow Jones now: Login or Open a new account!
• Open an account in the UK
• Open an account in Australia
• Open an account in Singapore
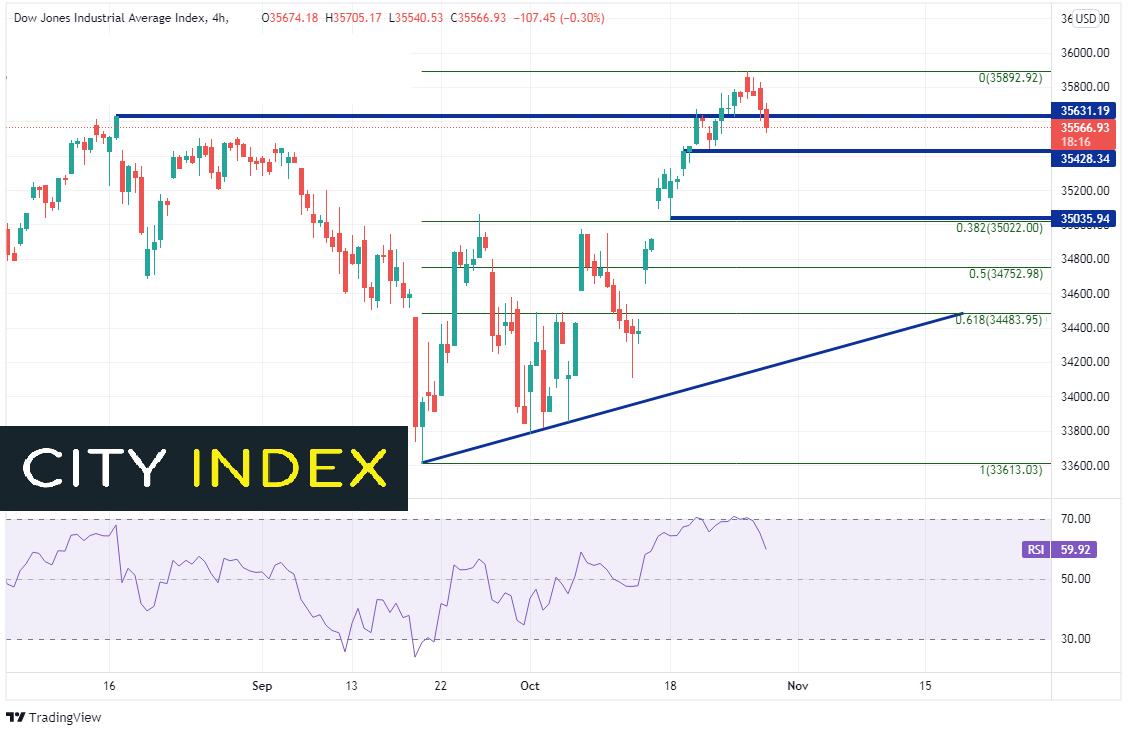
On a 240-minute timeframe, there is some intra-day horizontal support near 35,428. There is also horizontal support at 35,035.94, which confluences with the 38.2% Fibonacci retracement from the September 20th lows to October 27th highs. Below there opens a gap down to 34,934, and then the 50 Day Moving Average at 34,913. Resistance above is at the October 27th highs of 35,892.92, then the upward sloping trendline which dates to May 10th near 36,000 (see daily). Above there is the 127.2% Fibonacci extension from August 16th highs to the September 20th lows, near 36,172.78 (see daily).
Source: Tradingview, Stone X
Prior to Tuesday, the Dow Jones Industrial Average was up 9 sessions in a row. As earnings week came in full force, the stock index formed a shooting star and then a bearish engulfing pattern. One must wonder whether the run up into earnings was just a plain old “Buy the rumor, sell the fact”.
Learn more about index trading opportunities
Latest market news
Today 08:33 AM
Latest Dow Jones articles
April 15, 2024 01:14 PM
April 15, 2024 06:08 AM
April 9, 2024 01:15 PM
March 26, 2024 06:08 PM