


You will have seen the collapse in the British pound amid fears the UK economy is in a mess with negative growth at the same time when borrowing costs and inflation are both surging higher. These fears were exacerbated by UK’s questionable responses on both the fiscal and monetary policy fronts last week. In response, the GBP/USD slumped to a record low at the start of this week, before bouncing back a little. As fears mount over the UK’s economic outlook, there is a risk that the pound could even fall to parity.
How to short sell the pound
Before discussing shorting the pound, it is important to note that the GBP/USD's volatility has gone through the roof and the outlook is highly uncertain. The bulk of the selling might already be done, although that is not to say it has bottomed out yet. Thus, traders will need to be very nimble and mindful of their position sizes and other aspect of risk management when trading the pound long or short.
When shorting the pound or any other market for that matter, you would ideally want to enter the trade as close to resistance as possible. Selling into short-term strength, but inside a large bearish trend is the key. This means that on occasions you will miss big moves, but the market has a tendency to reward the patient and punish those chasing sharp moves.
That being said, you don’t always have to sell right into a rally. Sometimes, it might be better to wait for the market to find resistance, provide you the “sell” signal and then you can pounce on the opportunity. This way of trading gives you some structure to work with, so that you know exactly how many pips you are risking in the trade as you will have a clear invalidation level.
The beauty of the above entry methods is that it can be applied on all time frames, and you are not limited to just the daily chart, for example. This means that even though it might appear like you have missed a trade on, say, the daily time frame, it is possible to look into price action more closely on the smaller time frames in order to get on board and take advantage of the momentum.
We will discuss plenty of such examples on the hourly time frame, shortly.
But first, to give you some ideas of how you can look for short setups on the GBP/USD, here is a chart of the cable we provided in THIS article in mid-September:
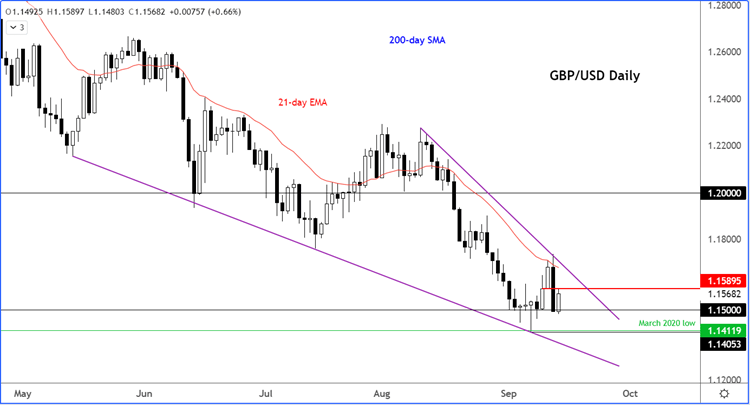
This was the daily chart of the GBP/USD showing price had bounced off the 1.1500 psychological level. We noted then that the GBP/USD was testing resistance around 1.1590, which was the low from Monday, earlier in the same week.
“This level was previously support but after Tuesday’s breakdown, it may turn into resistance. If the sellers step in here, then a push back down to the 1.15 handle would become likely. The March 2020 low at just above the 1.14 handle was tested last week. That level would be our extended objective in the event of a sell-off.”
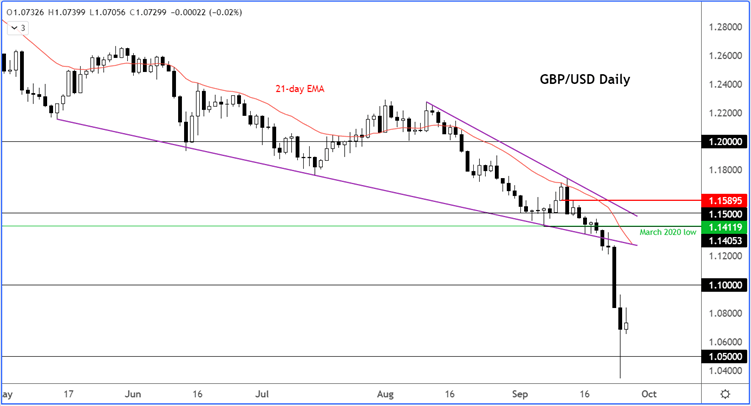
As it is often the case in a downtrend, old support levels turn into resistance and so it proved once again in the above example.
Trading the GBP/USD short in this case would have been straight forward. A limit or market order to initiate a sell position at or around 1.1590, with a stop loss above the high of Tuesday and trend line would have offered a significantly favourable reward-to-risk profile for the trade. Look at what happened next:
While the daily chart is what we concentrate on the most, trading off the daily time frame is not always the most efficient way to enter a trade, especially for short-term speculators.
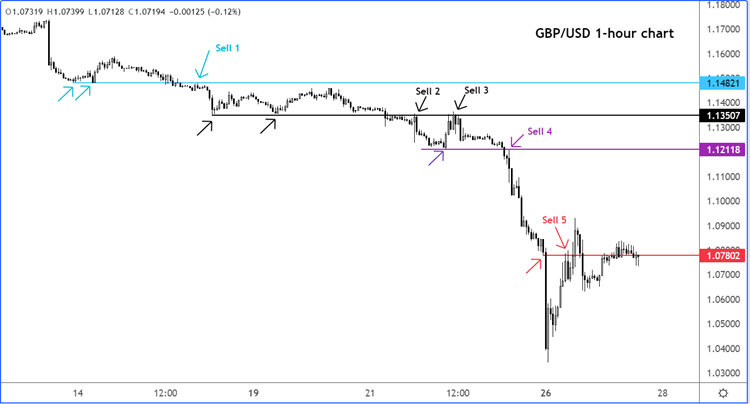
Zooming in to an intra-day time frame, in this case the hourly, below, we have highlighted several instances where one could have traded the pound short, as it started to drop:
Strategies for short selling the pound
Let’s discuss the 5 sell or short setups we have highlighted on the chart, above, in turn:
1. GBP/USD finds support around 1.1482, where it bounces on two or three occasions, before breaking below it. Once price returns to test this level from underneath, it starts heading lower. So, the entry in this example, could have been via a limit sell order, which could have been placed to go short at or just below 1.1482 as price was approaching this level form underneath. The stop loss could have been placed a few pips above the recent highs that were made prior to the breakdown.
2. In the example 2, the 1.1350 level had proved a tough nut to crack as rates bounced there a few times. But when price finally went below it, you can see how the sellers were determined to defend their ground as price hardly went above that same level again, before dropping by 140 pips or so. Again, the entry could have been very similar to the example 1, above.
3. The third entry signal was formed when rates momentarily broke old resistance at 1.1350, before quickly going back below it as the bulls lacked conviction. Sensing this weakness, the bears stepped in to push rates down below old support at 1.1211, before that big sell-off occurred that eventually saw the cable hit a new all-time low. In this case, the entry could have been with a market order, after that brief fake out was observed.
4. Entry number 4 could have easily been missed as rates spiked higher to re-test the broken support at 1.1211, before taking a plunge. This is why limit orders are useful in such situations. Another way to take advantage of such big falls below a support level is to place a sell entry order a few pips below support (in this case at 1.1211). This strategy is a bit risky however as sometimes the market might take you in, but then quickly go in the other direction. The stop loss would need to be a bit wide to take into account such risks.
5. The last example on the chart is a trade that may or may not have worked. The idea here was to sell the retest of the point of origin of the breakdown at 1.0780. While the GBP/USD did react there as it dropped by more than 100 pips, it then quickly rebounded to climb above that level (before fading again). If the objective was to make a quick trade, this may have provided enough room for profit. However, those looking for another big plunge would have probably been shaken out by that second wave higher. This is why it is important to create a habit of taking at least some profit after a decent move.
The above examples are only based on the re-test of broken support levels, which is my bread-and-butter strategy when looking for a short trade. But there are numerous other ways to enter trades. These could be based, for example, on some momentum indicators like the MACD or RSI, or the trigger could be a crossover of moving averages or price reaching certain areas of the Bollinger bands, etc.
How to trade GBP with City Index
You can trade with City Index by following these four easy steps:
-
Open an account, or log in if you’re already a customer
• Open an account in the UK
• Open an account in Australia
• Open an account in Singapore
- Search for the company you want to trade in our award-winning platform
- Choose your position and size, and your stop and limit levels
- Place the trade