


Gold holds above $2000 ahead of the Fed rate decision
Gold is holding steady above 2015 ahead of the Fed rate decision and after rising over 1.7% in the previous session.
Gold rallied on Tuesday as yields dropped and amid renewed fears over contagion in the US gaming system. There was no clear catalyst for the selloff in US regional banks, but it is unlikely a coincidence that the selloff happened as the Fed kicked off the two-day monetary policy meeting.
Expectations are for the Fed to hike rates by 25 basis points. The challenge for Federal Reserve Chair Powell will be how to communicate the central bank’s next move to a market that is pricing in a pause and several rate cuts by the end of the year.
If the Fed signals that it will pause rate hikes, this could be beneficial for non-yielding gold and could also signal that the Fed is concerned over the health of the financial system, which could drive more safe haven flows.
Also boosting gold’s appeal is the ongoing concerns over a potential US default as debt ceiling negotiations continue. Treasury Secretary Janet Yellen warned that the US could run out of money in early June.
Gold forecast: technical analysis
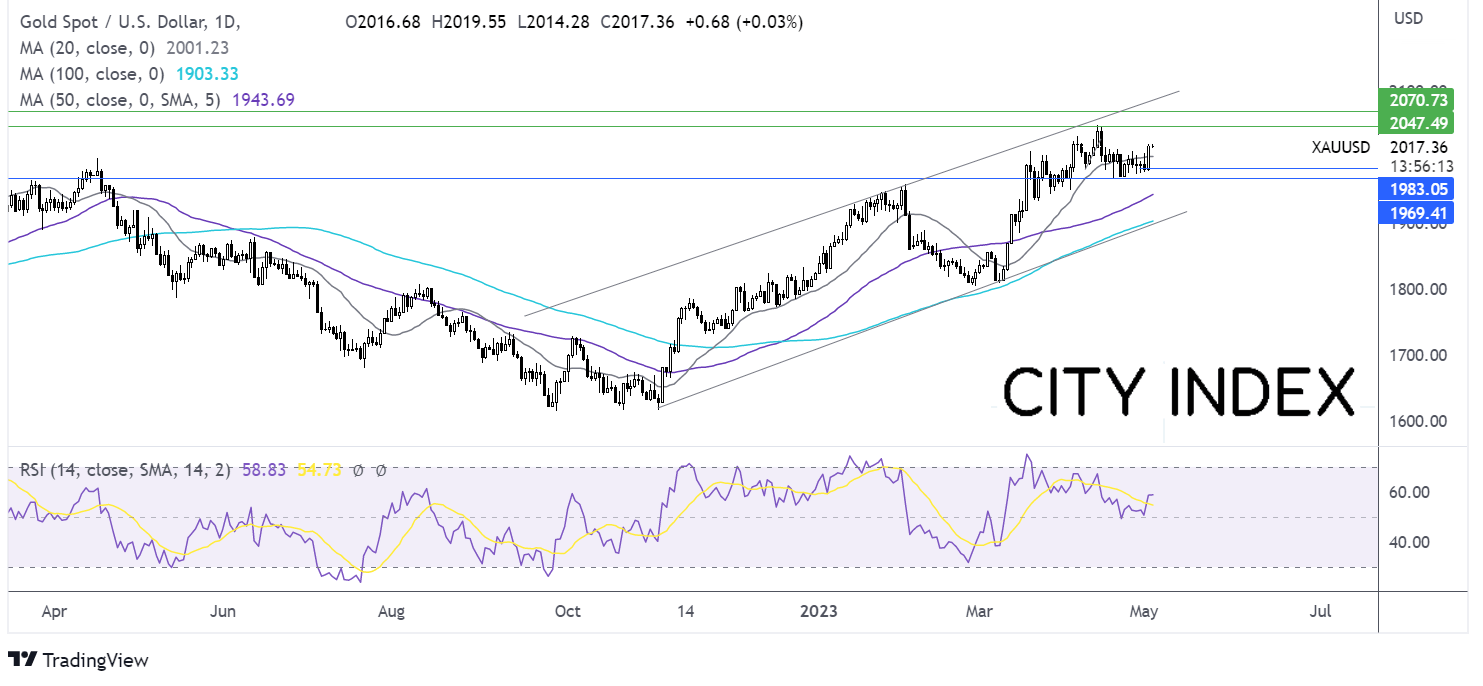
Gold continues to trade in a rising channel dating back to the end of last year, and trades within a relatively narrow range in recent weeks of 1969 to 2050.
The rise above the 20 sma, together with the RSI above 50 keeps buyers hopeful of further gains. A recovery in the gold price towards 2050 first needs validation above 2032 the April 5 high, to brig 20250 into target. Beyond here, 2075, the all-time high comes into play.
On the flipside, a fall below 2000, the 20 sma and psychological level, brings 1983 the weekly low and 1969 into focus.
Oil steadies at a 5 week low ahead of the Fed, EIA data
Oil fell over 5% yesterday dropping to a five week low on fears of worsening economic conditions hurting the oil demand outlook.
A larger than expected draw in US crude oil inventories failed to support oil market after a string of manufacturing data raised concerns over slowing global economic growth. US manufacturing PMI data in the US, eurozone and UK, coupled with falling US factory orders and contraction in Chinese manufacturing point to a weaker outlook.
According to the API, US inventories shrank by 3.9 million barrels in the week ending April 28th, while the gasoline and distillate stockpiles raised concerns over fuel demand. The data comes ahead of the EIA stockpile data later today.
The focus is now squarely on the Federal Reserve interest rate decision later today. The Fed is expected to raise rates by 25 basis points, but the decision comes amid deteriorating economic activity.
Oil forecast: technical analysis
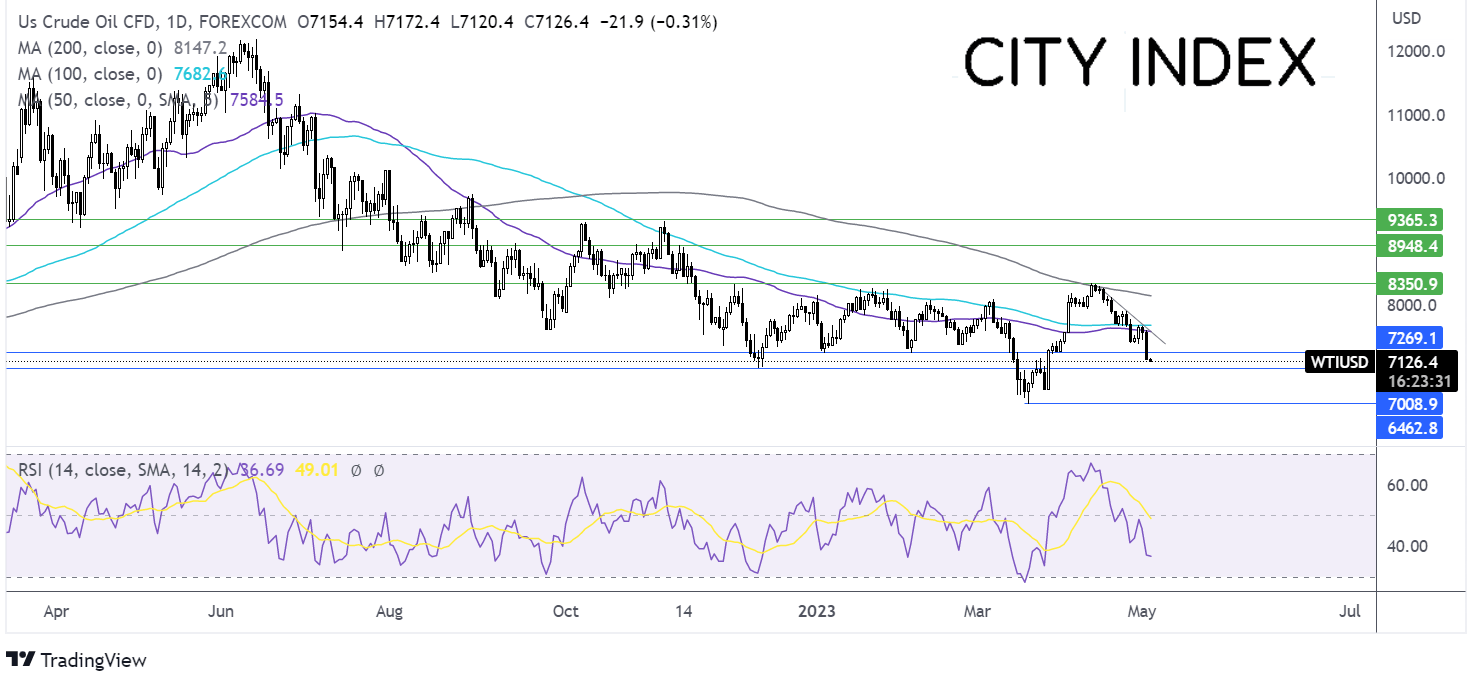
After running into resistance at the 200 sma oil prices have fallen below the 50 & 100 sma and support at 72.70. This combined with the RSI below 50 keeps sellers hopeful of further losses.
Bears will look for a fall below 70.00 the December low and the psychological level. A break below here opens the door to 66.85 the March 24 low and 64.334 the 2023 low.
On the flipside, buyers need to rise above 72.70 to open the door to 75.30 the falling trendline resistance. A rise above here exposes the 50 sma at 76.00.
Latest market news
Today 08:33 AM
Latest Trade Ideas articles