


February 18, 2022 8:00 AM
As one of the first major central banks to raise rates, the Bank of England has been hawkish and should remain so until their upcoming Interest Rate Decision meeting on March 17th. After all, the jobs data appears to be strong, with the January Claimant Count falling by 31,900 vs an estimate of a 28,000 decline. In addition, Average Hourly Earnings, including bonuses, was better at 4.3% vs 3.8% expected. Inflation data was higher as well for January, with the headline CPI print at 5.5% YoY vs 5.4% YoY expected. Also, the Core CPI data was higher for January, printing 4.4% YoY vs an expectation of 4.3% YoY. With both the jobs data and the inflation data looking strong, GBP/USD has been moving higher.
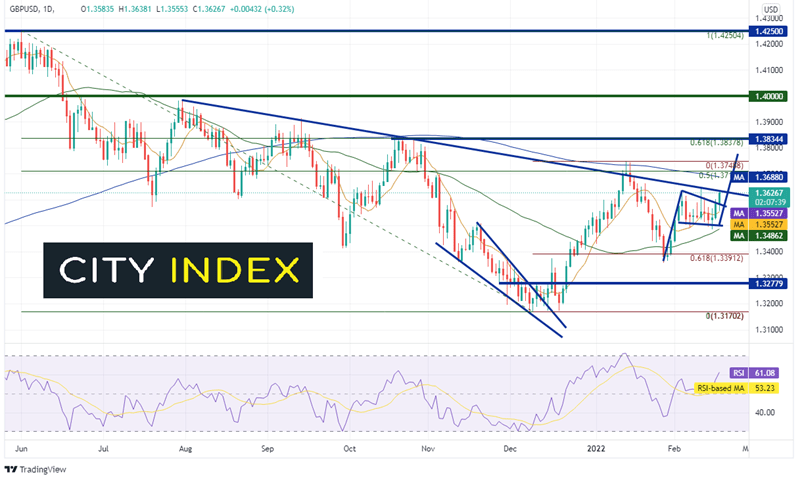
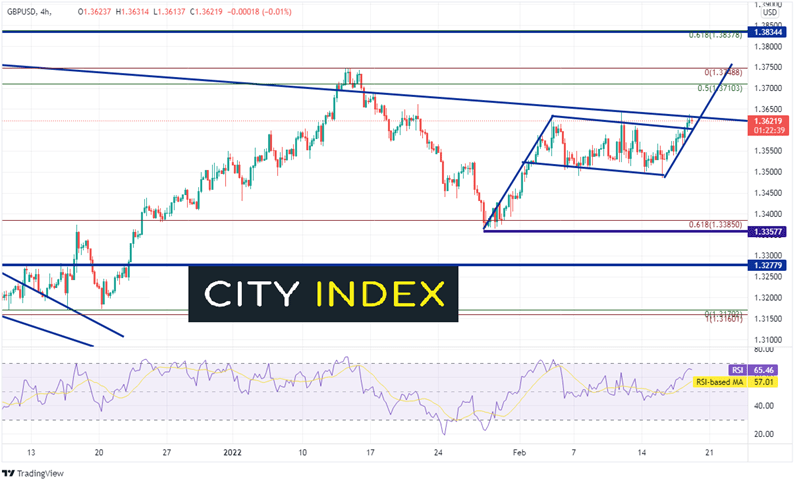
GBP/USD had been moving lower since June 1st, 2021 when the pair made a near-term top at 1.4250. It then bottomed on December 9th, 2021 in a descending wedge pattern at 1.3170. GBP/USD broke out of the wedge and retraced 50% of that range to 1.3748. It also posted a false breakout above a downward sloping trendline dating to July 30th, 2021 and the 200 Day Moving Average near the 1.3710 level. The pair then pulled back to the 61.8% Fibonacci retracement level from the December 9th, 2021 lows to the January 13th highs, near 1.3391, and has consolidated in a flag pattern. On Thursday, GBP/USD broke above the flag and is trying to close back above the trendline from July 30th, 2021.
Source: Tradingview, Stone X
Trade GBP/USD now: Login or Open a new account!
• Open an account in the UK
• Open an account in Australia
• Open an account in Singapore
The target for the flag pattern is near the January 13th highs at 1.3760. If price is to get to the target, it must close above the trendline from July 30th 2021 at 1.3635 and the 200 Day Moving Average at 1.3688 (see daily). The next resistance is at the January 13th highs at 1.3749. Above the target, resistance is at the 61.8% Fibonacci retracement from the longer-term range at 1.3838. First support is just below at the top trendline of the flag near 1.3600. Below there, support is at the lows of the flag and the 50 Day Moving Average near 1.3486 and then the January 27th lows of 1.3358.
Source: Tradingview, Stone X
The Bank of England will get to see one more jobs report before their March 17th meeting. However, the inflation data won’t be until the day after the meeting. Therefore, the recent CPI data should carry a good deal of weight. As the markets are looking for a 25bps hike already, they may begin pricing in a 50bps hike. If so, GBP/USD so continue to move higher.
Learn more about forex trading opportunities.
Latest market news
Yesterday 08:33 AM