


You have probably heard that the Fed raised by 25bp yesterday, and the market reaction assumed it was a dovish press conference due to 50bp of cuts now beginning to be priced in. It is an interest reaction, given the statement’s wording of upcoming hike(s) – which implies a 25bp hike in March and May to take rates to 5.25%. Yet the Fed fund futures curve implies a terminal rate of 5% and for the final hike in the cycle to be in March. That is basically money markets calling bulldust to the Fed.
Read Matt Weller’s FOMC recap: Powell not hawkish enough, traders price in 50bps of cuts by EOY
Current market pricing implies:
- The Fed’s terminal rate to be 5.0%
- A final 25bp hike in March, then hold at 5% from May
- First 25bp could arrive in November
- Followed by another 25bp cut in December
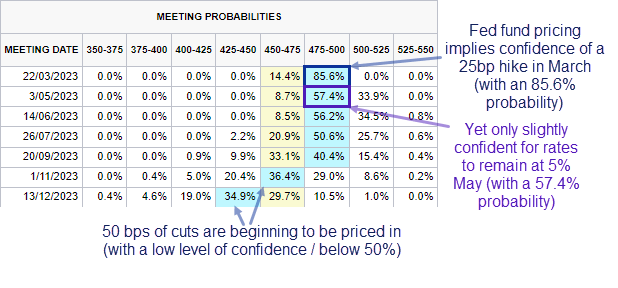
Furthermore, Fed funds also imply a 25bp cut in November and December, whereas previously it was for a single cut in November. With that said, the confidence of said cuts are quite low at 36.4% and 34.9% respectively. And there’s only a 57.4% probability of the rates remaining at 5% in May (with an 8.7% chance of a cut). The long and short of this is that the only thing with confidence is another 25bp hike in May.
And for that reason, I feel inclined to simply listen to what the hawkish Fed are saying, which is they intend to keep rates high and currently expect to hike to 5.25% over the next two meetings (in defiance to money market pricing).
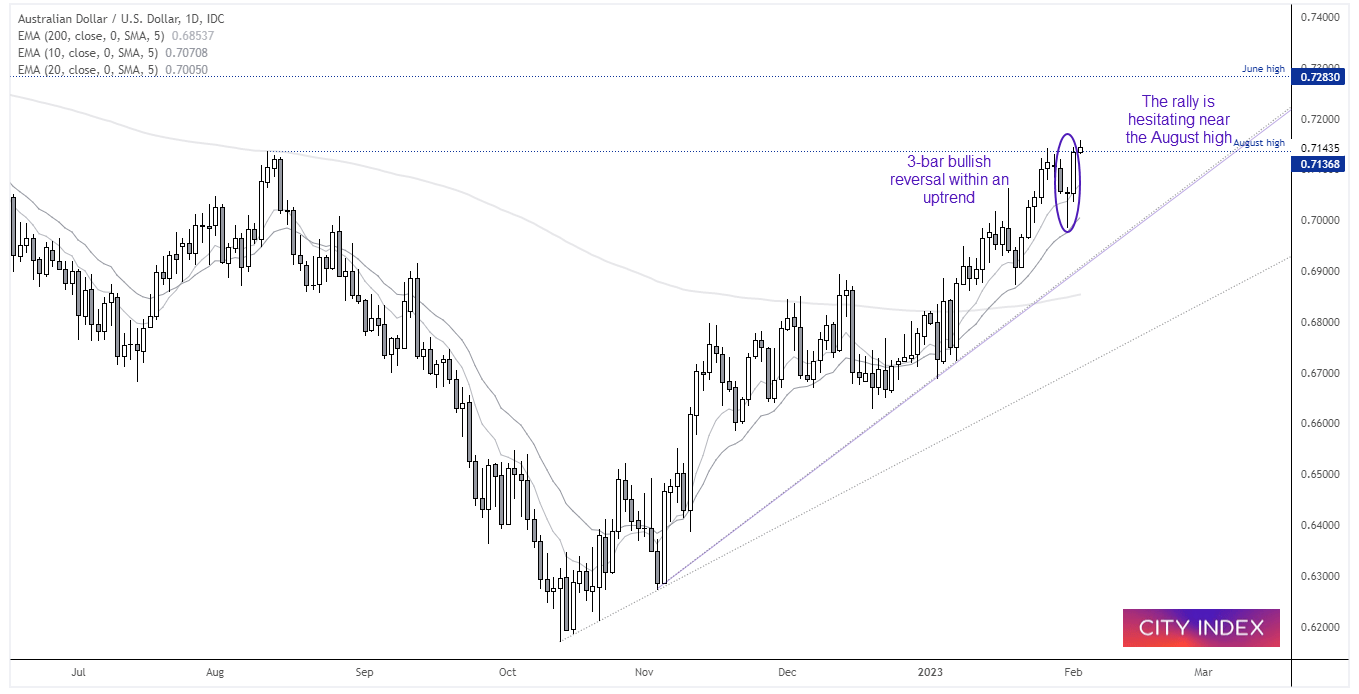
AUD/USD daily chart:
The weaker dollar helped AUD/USD breaking to its highest level since June, just above the August 2022 high. A nice bullish pinbar formed on Tuesday ahead of the latest push higher, although today’s Asian session has lacked any sort of follow-through.
The 20-day EMA has provided support and the trend remains strong overall. So at this stage we’re keen to seek bullish setups, should prices pull back from current levels. For example, low volatility retracements within yesterday’s range would pique our interest for potential longs.
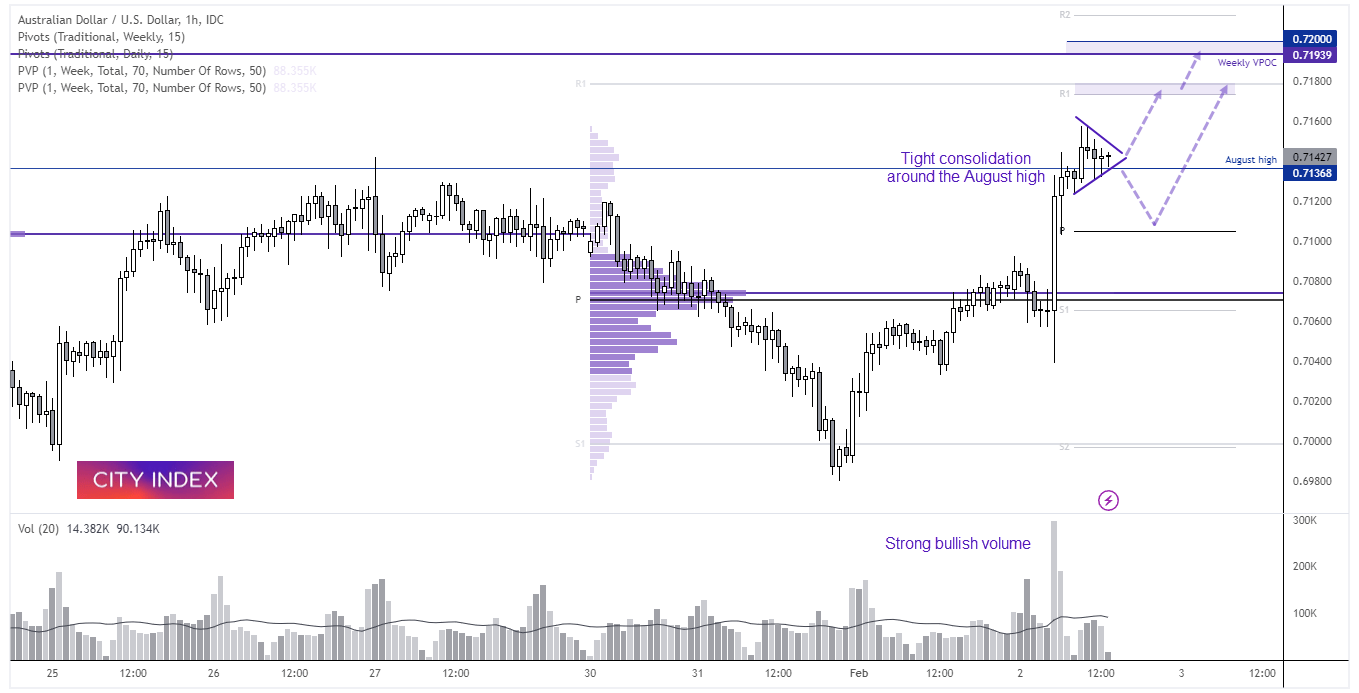
AUD/USD 1-hour chart:
A small consolidation pattern is forming around the August high, which would usually imply a breakout inline with its (bullish trend). However, heading into the European open we’re on guard for a spike lower as well – but would consider bullish setups above 0.7100 / daily pivot point. The daily R2 and weekly R1 pivots are around 0.7180 and make viable targets for bulls, a break above which brings 0.7200 into focus (near the weekly VPOC and round number of 72c).