


Asian Indices:
- Australia's ASX 200 index fell by -38 points (-0.56%) and currently trades at 6,779.50
- Japan's Nikkei 225 index has fallen by -87.7 points (-0.76%) and currently trades at 11,485.50
- Hong Kong's Hang Seng index has fallen by -202.75 points (-1.13%) and currently trades at 17,809.40
- China's A50 Index has fallen by -48.18 points (-0.37%) and currently trades at 12,908.11
UK and Europe:
- UK's FTSE 100 futures are currently down -15.5 points (-0.22%), the cash market is currently estimated to open at 6,981.77
- Euro STOXX 50 futures are currently down -7 points (-0.2%), the cash market is currently estimated to open at 3,426.45
- Germany's DAX futures are currently down -16 points (-0.13%), the cash market is currently estimated to open at 12,454.78
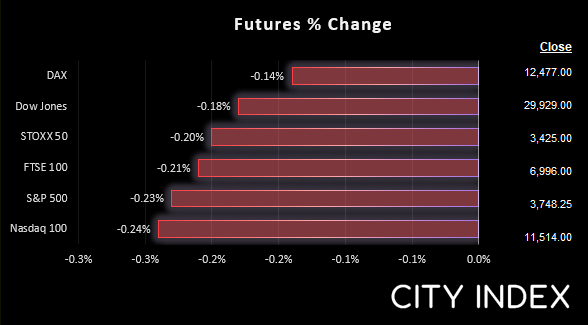
US Futures:
- DJI futures are currently down -60 points (-0.2%)
- S&P 500 futures are currently down -31.25 points (-0.27%)
- Nasdaq 100 futures are currently down -9.5 points (-0.25%)
Asian equity markets were lower as they traced Wall Street to the downside ahead of today’s NFP report. Should we see a strong report it could send yields and the US dollar higher, as traders gain (even more) confidence that that the Fed need to work hard to cool the economy down. And that could weigh further on equity markets and make the so-called ‘risk-on rally for equities seen earlier this week seem like a distant past.
Volatility was its usual quiet self for currency pairs ahead of today’s NFP report. USD/JPY meandered around 145 after closing above it for the first time since in 24 years yesterday. As of yet there has been no obvious signs of intervention or jawboning from the BOJ or MOF. And until then, price remain king.
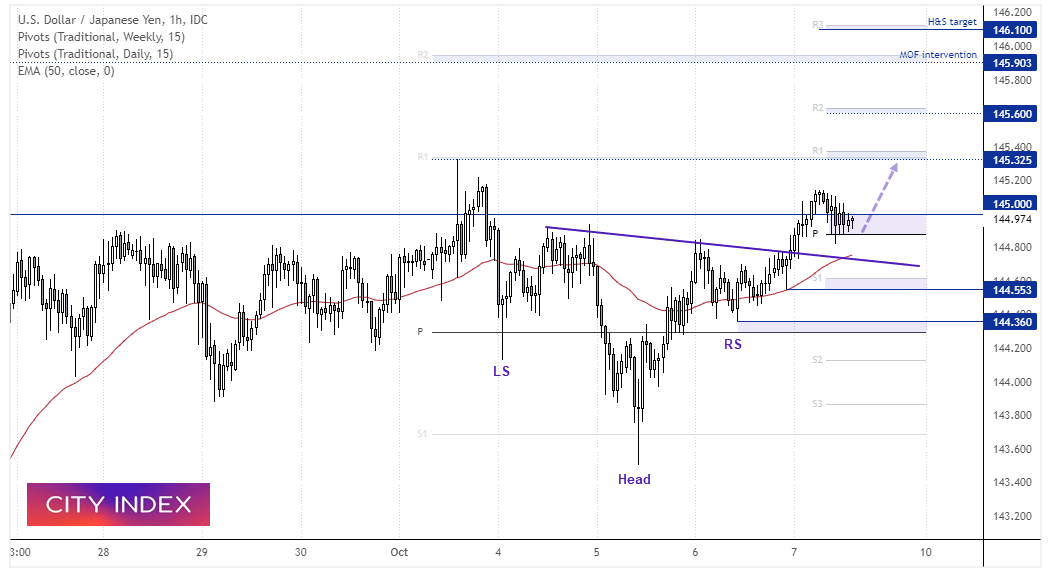
USD/JPY 1-hour chart:
A bullish trend has developed on the 1-hour chart after breaking out of an inverted head and shoulders pattern – which can be a bullish continuation pattern during an uptrend. It projects a target around 146.1 / daily R3 pivot, but we prefer to focus on more conservative targets with the potential for central authorities to get involved. The bias remains bullish above the neckline and for an initial move to 143.33 – a break above which assumes bullish continuation.
FTSE 350 – Market Internals:
FTSE 350: 3860.66 (-0.78%) 06 October 2022
- 191 (54.57%) stocks advanced and 152 (43.43%) declined
- 1 stocks rose to a new 52-week high, 8 fell to new lows
- 17.14% of stocks closed above their 200-day average
- 38% of stocks closed above their 50-day average
- 4% of stocks closed above their 20-day average
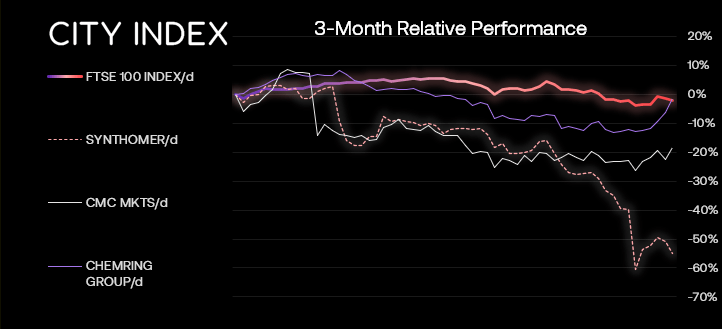
Outperformers:
- + 5.87% - Volution Group PLC (FAN.L)
- + 5.62% - CMC Markets PLC (CMCX.L)
- + 5.43% - Chemring Group PLC (CHG.L)
Underperformers:
- -8.27% - Synthomer PLC (SYNTS.L)
- -4.92% - Kingfisher PLC (KGF.L)
- -4.44% - Centrica PLC (CNA.L)
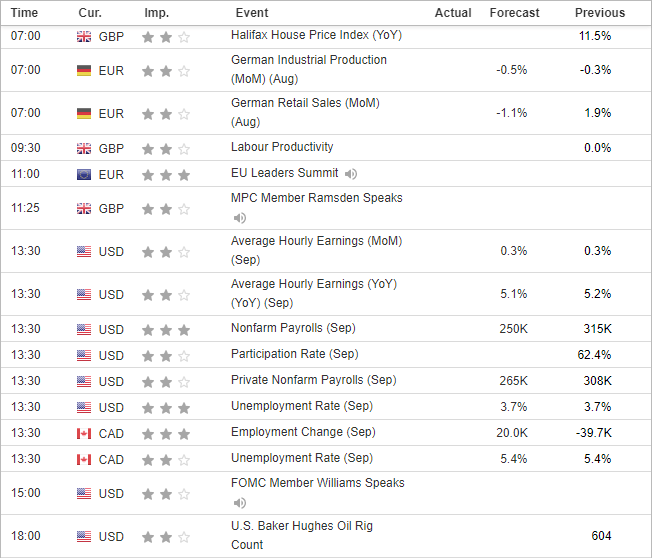
Economic events up next (Times in BST)
How to trade with City Index
You can easily trade with City Index by using these four easy steps:
-
Open an account, or log in if you’re already a customer
• Open an account in the UK
• Open an account in Australia
• Open an account in Singapore
- Search for the company you want to trade in our award-winning platform
- Choose your position and size, and your stop and limit levels
- Place the trade
Latest market news
Latest Technical Analysis articles
April 15, 2024 07:13 PM
April 14, 2024 11:37 PM
April 13, 2024 08:00 PM
April 12, 2024 04:51 AM