


Asian Indices:
- Australia's ASX 200 index fell by -36.3 points (-0.51%) and currently trades at 7,139.50
- Japan's Nikkei 225 index has risen by 60.14 points (0.22%) and currently trades at 27,582.40
- Hong Kong's Hang Seng index has fallen by -218.21 points (-0.87%) and currently trades at 24,747.34
- China's A50 Index has fallen by -30.87 points (-0.2%) and currently trades at 15,430.44
UK and Europe:
- UK's FTSE 100 futures are currently down -12.5 points (-0.17%), the cash market is currently estimated to open at 7,481.63
- Euro STOXX 50 futures are currently down -15.5 points (-0.37%), the cash market is currently estimated to open at 4,214.06
- Germany's DAX futures are currently down -30 points (-0.19%), the cash market is currently estimated to open at 15,573.88
US Futures:
- DJI futures are currently up 250 points (0.73%)
- S&P 500 futures are currently up 126.25 points (0.88%)
- Nasdaq 100 futures are currently up 35 points (0.8%)
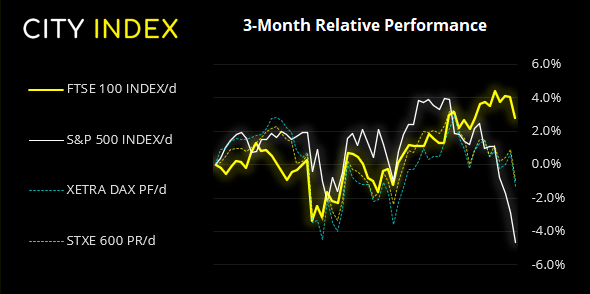
Asian equities tracked Wall Street lower overnight as investors brace themselves for a hawkish Fed. Yet the pattern across futures markets is less one-sided. US futures have opened lower, although they remain below the midway point of Friday’s bearish ranges. Yet European futures have opened lower which points to a weak open for the cash market. As we noted in today’s video we’re keeping a close eye on the STOXX 600 to see whether it can remain above a key trendline, or break it to then target the December lows.
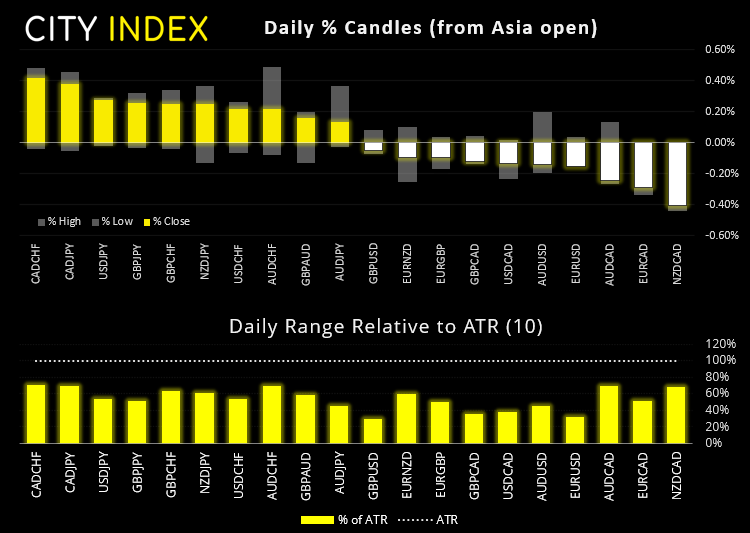
Volatility remained capped across currencies
Currency markets essentially retraced against Friday’s moves, which saw the yen and Swiss franc as the weakest majors and NZD the strongest. We’re not reading too much into these moves at this stage, but it does highlight that overnight was not fully risk-off despite the sell-off across Asian equities.
The US dollar index looks like it wants to test Friday’s high and potentially breakout, in line with Friday’s bias. EUR/USD is testing the monthly pivot point form above, but we’re waiting for a break below 1.1300 (Friday’s low) to signal its next leg lower. EUR/GBP was a top performer on Friday although prices have pulled back from 0.8375 resistance, a break of which confirms a deeper retracement against its bearish trend is underway.
Friday’s candle was its most bullish in 5-weeks, and clearly shows a momentum shift at 0.8300 support. Prices are pulling back towards the weekly pivot point, and we’re now seeking evidence of a higher low to form ahead of an anticipated break above Friday’s high.
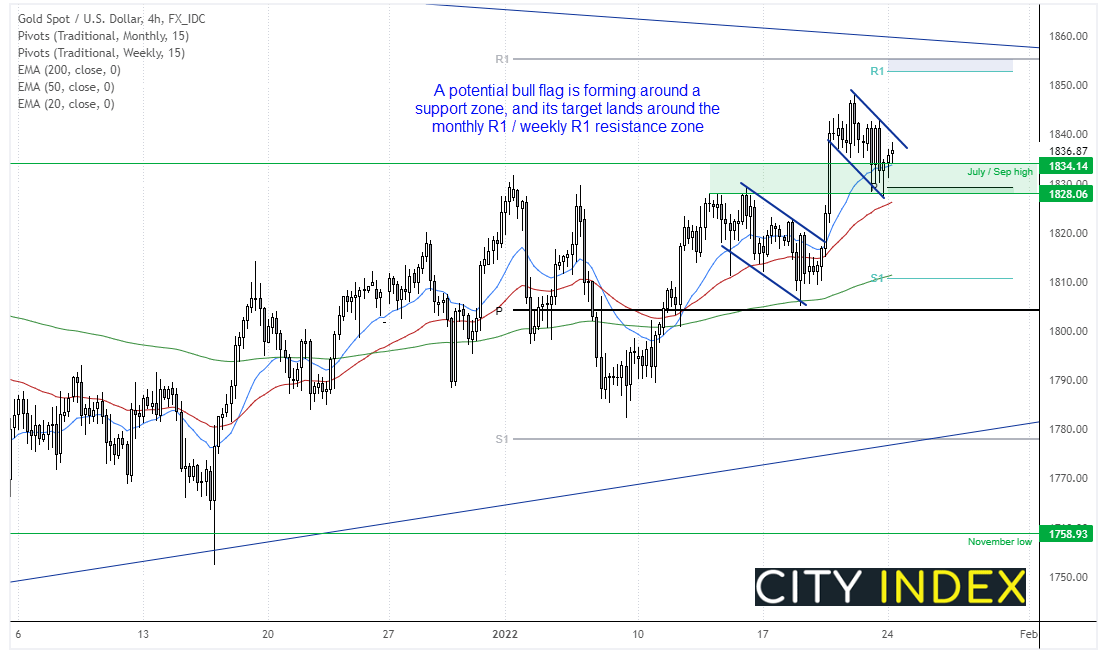
Gold is forming a potential bull flag at support
Gold may not have broken higher as we’d hoped on Friday but that it not to say it can’t some time this week. The original 1834 breakout level has been breached but we do like how a bullish hammer has formed on the four-hour chart and that prices are back above the 20-bar eMA. Furthermore, support has been found at the weekly pivot point and prices are forming a potential flag pattern. A break beneath 1828 warns of a deeper retracement and, until then, the bias is for a break higher from the flag. Initial target is the weekly R1 / monthly S1 pivots.
FTSE 350: Market Internals
Friday was its most bearish day for the FTSE 100 in nearly 8-weeks. Momentum turned lower after several failed attempts to break above 7600 and a countertrend move is clearly underway within its bullish channel. Yet it should noted that the FTSE can (and usually does) dance to its own turn, and such bearish das do not always lead to continued selling. In fact, each time the FTSE has fallen over 1% since July, the next day has seen it trade higher.
FTSE 100 trading guide>
FTSE 350: 4242.16 (-1.20%) 21 January 2022
- 25 (7.12%) stocks advanced and 321 (91.45%) declined
- 1 stocks rose to a new 52-week high, 16 fell to new lows
- 41.6% of stocks closed above their 200-day average
- 100% of stocks closed above their 50-day average
- 10.26% of stocks closed above their 20-day average
Outperformers:
- + 1.73% - John Wood Group PLC (WG.L)
- + 1.71% - 4imprint Group PLC (FOUR.L)
- + 1.69% - Premier Foods PLC (PFD.L)
Underperformers:
- -20.67% - Playtech PLC (PTEC.L)
- -10.58% - Trainline PLC (TRNT.L)
- -8.72% - Baltic Classifieds Group PLC (BCG.L)
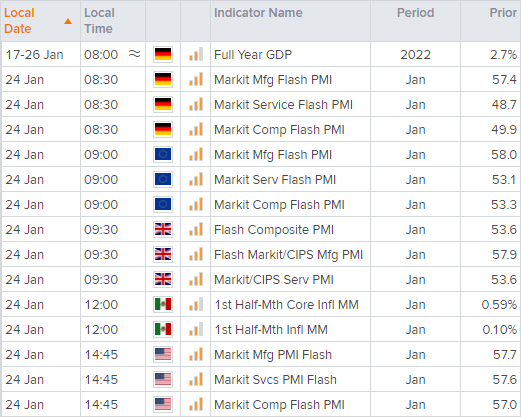
Up Next (Times in GMT)
How to trade with City Index
You can easily trade with City Index by using these four easy steps:
-
Open an account, or log in if you’re already a customer
• Open an account in the UK
• Open an account in Australia
• Open an account in Singapore
- Search for the company you want to trade in our award-winning platform
- Choose your position and size, and your stop and limit levels
- Place the trade
Latest market news
Today 01:15 PM
Today 11:30 AM
Today 08:18 AM
Latest Forex articles


Yesterday 11:30 AM
Yesterday 03:42 AM