


Asian Indices:
- Australia's ASX 200 index fell by -36.6 points (-0.49%) and currently trades at 7,491.30
- Japan's Nikkei 225 index has fallen by -409.34 points (-1.47%) and currently trades at 27,378.64
- Hong Kong's Hang Seng index has fallen by -306.67 points (-1.36%) and currently trades at 22,195.64
- China's A50 Index has fallen by -28.9 points (-0.21%) and currently trades at 13,980.69
UK and Europe:
- UK's FTSE 100 futures are currently down -3.5 points (-0.05%), the cash market is currently estimated to open at 7,610.22
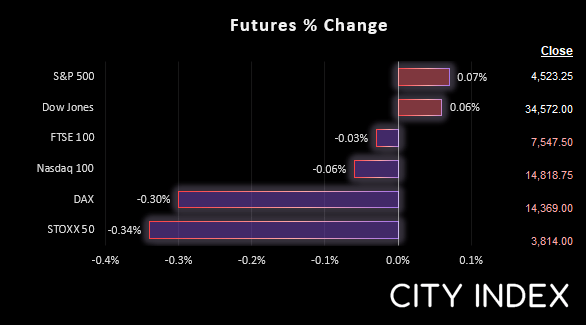
- Euro STOXX 50 futures are currently down -13 points (-0.34%), the cash market is currently estimated to open at 3,904.85
- Germany's DAX futures are currently down -43 points (-0.3%), the cash market is currently estimated to open at 14,381.36
US Futures:
- DJI futures are currently up 16 points (0.05%)
- S&P 500 futures are currently down -10.75 points (-0.07%)
- Nasdaq 100 futures are currently up 2 points (0.04%)
Equity markets continued to feel the weight of the Fed’s hawkish comments overnight as Asian indices traded broadly lower. The Nikkei was the worst performer and fell around -1.7%. Weak China service PMI also added to the slight risk-off vibe as contracted at its fastest pace since February 2020 and new orders hit a 6-year low.
Futures markets are pointing lower for European bourses, although the FTSE remains relatively flat and the index remains an outperformer of late.
FTSE: Market Internals
The FTSE 100 rose to a 14-month high and closed above 6800 yesterday with above-average volume. The four-hour chart remains in a strong uptrend and its 20-bar eMA has provided dynamic support. It has held above the weekly pivot point and broken out of a tight consolidation range, and it’s encouraging that it closed above the weekly R1 pivot and at the high of the day.
Ideally, we’d like to see the FTSE hold above the top of the prior consolidation around 7575 should it retrace, otherwise a break of yesterday’s high assumes bullish continuation with 7650 being the initial target ahead of the February high.
FTSE 350: 4269.86 (0.72%) 05 April 2022
- 176 (50.14%) stocks advanced and 166 (47.29%) declined
- 22 stocks rose to a new 52-week high, 2 fell to new lows
- 37.32% of stocks closed above their 200-day average
- 12.82% of stocks closed above their 20-day average
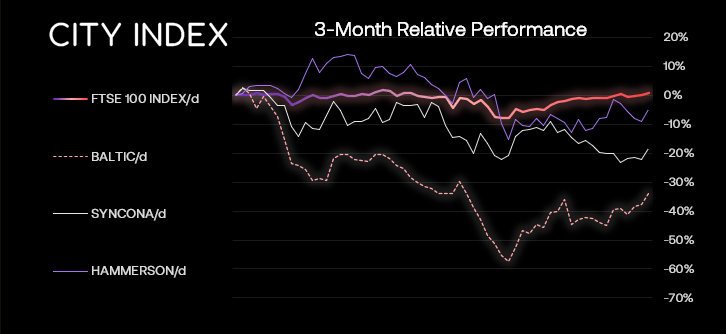
Outperformers:
- + 5.73% - Baltic Classifieds Group PLC (BCG.L)
- + 4.52% - Syncona Ltd (SYNCS.L)
- + 4.33% - Hammerson PLC (HMSO.L)
Underperformers:
- -5.85% - Darktrace PLC (DARK.L)
- -5.31% - TI Fluid Systems PLC (TIFS.L)
- -5.18% - Moneysupermarket.Com Group PLC (MONY.L)
Today’s FOMC minutes may have been overshadowed
Hawkish comments from key Fed members yesterday likely overshadows today’s FOMC minutes, as they point towards a 50-bps hike at the next FOMC meeting and a faster balance sheet reduction than anticipated. Daly thinks they can raise rates without triggering a recession or stagflation, and Brainard sees that controlling inflation (by raising rates) as their most important task.
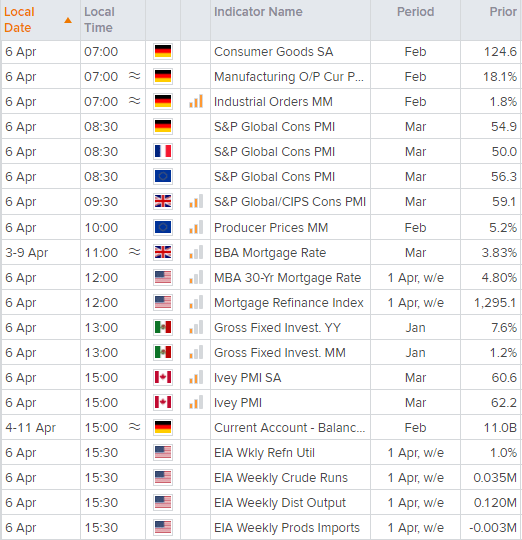
PMI data for Europe and Canada up next
Given the weakness in global PMI’s since the war in Ukraine (and the fact the February reports did not capture it) then it is likely we’ll see further weakness today. The question is how much and whether these reads will contract, with weak new orders.
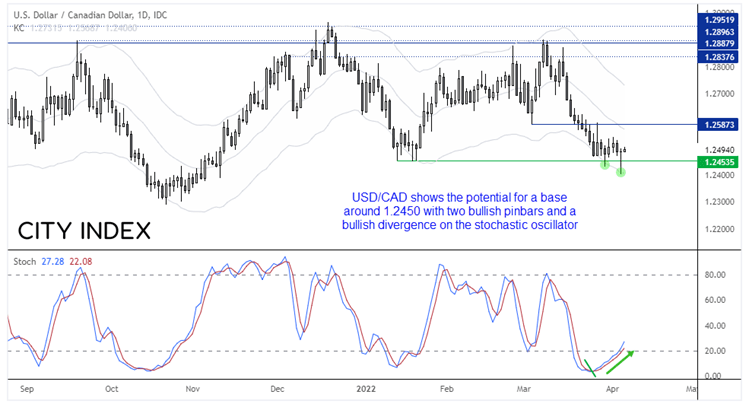
But should we see another hawkish surprise in today’s FOMC minutes coupled with a weak PMI print for Canada, USD/CAD looks interesting for potential long setups.
The downtrend on the daily chart has failed to see a daily close beneath the January low of 1.2453. Two bullish hammers have formed and a buy signal and bullish divergence has formed on the stochastic oscillator. Furthermore, the lows of the hammers have respected the lower Keltner band. Ultimately, we now see the potential for some mean reversion and a break above 1.2500 on the cards and for it to head towards 1.2560, or near tis 20-day eMA. A daily close above these levels suggests it may be more than mean reversion.
Up Next (Times in BST)
How to trade with City Index
You can easily trade with City Index by using these four easy steps:
- Open an account, or log in if you’re already a customer
- Search for the company you want to trade in our award-winning platform
- Choose your position and size, and your stop and limit levels
- Place the trade
Latest market news
Today 11:14 AM
Today 08:28 AM
Yesterday 03:30 PM
Latest Forex articles
Yesterday 11:00 AM
April 23, 2024 11:09 PM
April 23, 2024 04:00 PM