


Asian Indices:
- Australia's ASX 200 index rose by 51.3 points (0.73%) and currently trades at 7,114.90
- Japan's Nikkei 225 index has risen by 177.84 points (0.0069%) and currently trades at 25,998.64
- Hong Kong's Hang Seng index has risen by 110.16 points (0.52%) and currently trades at 21,162.33
- China's A50 Index has risen by 75.38 points (0.57%) and currently trades at 13,406.61
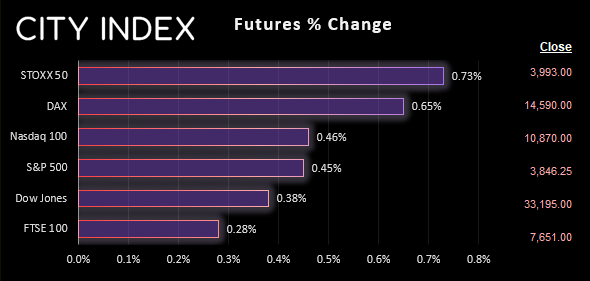
UK and Europe:
- UK's FTSE 100 futures are currently up 22.5 points (0.29%), the cash market is currently estimated to open at 7,655.95
- Euro STOXX 50 futures are currently up 29 points (0.73%), the cash market is currently estimated to open at 3,988.48
- Germany's DAX futures are currently up 94 points (0.65%), the cash market is currently estimated to open at 14,530.31
US Futures:
- DJI futures are currently up 125 points (0.38%)
- S&P 500 futures are currently up 50 points (0.46%)
- Nasdaq 100 futures are currently up 17.25 points (0.45%)
- With inflation data for Germany, France and Spain falling below expectations this week, there’s hope we’ll see a similar result for EU CPI today
- That said, a soft inflation print is unlikely to deter the ECB from hiking at their next two meetings (in 50bp increments)
- NFP is the main event and 200k jobs added is the consensus and for unemployment to remain at 3.7%
- Yet a firm ADP report yesterday has helped to support the US dollar ahead of today’s NFP report, in anticipation of a beat
- Whilst 200k is low in recent history and shows a loss of momentum (which the Fed expect anyway), it is not likely enough for the Fed to become dovish
- Therefore 200k or more jobs added today could continue to support the (arguably oversold) US dollar
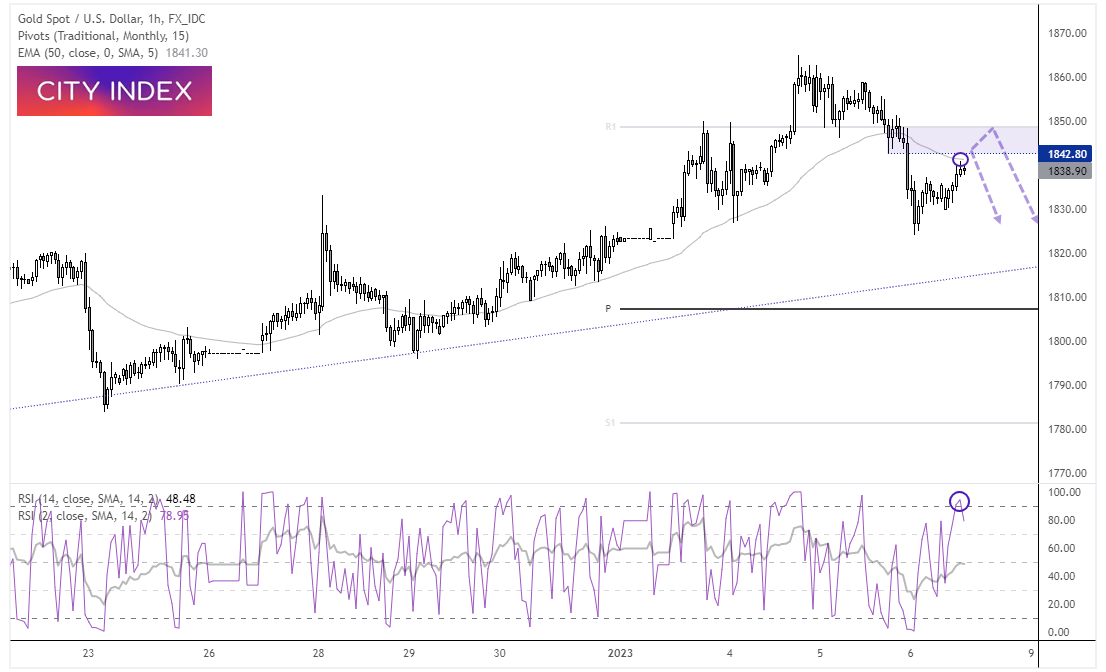
Gold 1-hour chart:
Gold had a great start to the year during a period of low liquidity, although yesterday’s bearish outside/engulfing day suggests some mean reversion is due. With the 20-day EMA and bullish trendline residing around $1815, I’m not looking for an oversized countertrend move on the daily chart (yet). But it might provide a decent bearish opportunity for intraday traders if NFP surprises to the upside.
Today’s bias remains bearish below $1850 near the weekly R1 pivot. The 50-bar EMA and 1842.80 low is capping as resistance, which places a zone between 1842 – 1850 to seek evidence of a potential top. The RSI (2) is overbought and price action is within its third wave higher, which suggest a near-term corrective top could be approaching.
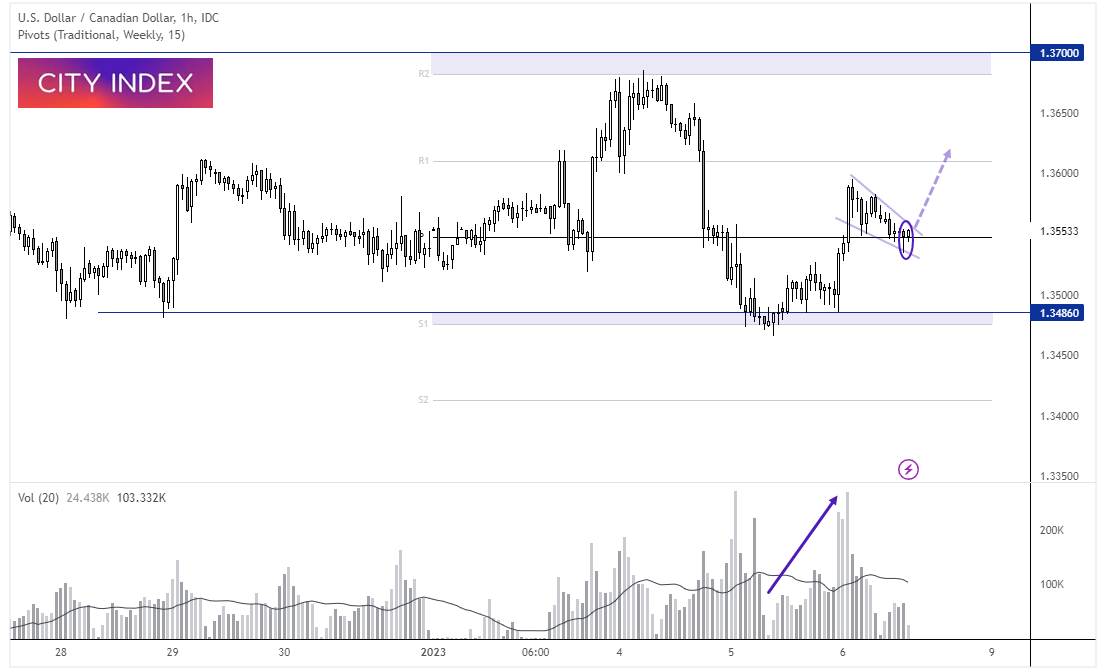
USD/CAD 1-hour chart:
Price action on the daily chart has been less than ideal in recent weeks due to its choppy and erratic nature. But it has carved out a decent range between 1.347 – 1.370 over this period of time, and that could provide better opportunities on the 1-hour chart.
The rally from the weekly S1 was seen on rising (and above) volume to show new buyers entering the market. Prices have since retraced within a falling wedge pattern, which is a potential bullish reversal. Support has since been found on the weekly pivot point with a small bullish hammer. We’re now looking for momentum to turn higher and head for 1.3600 – which would be greatly helped should NFP surprise to the upside whilst Canada’s employment is worse for wear.
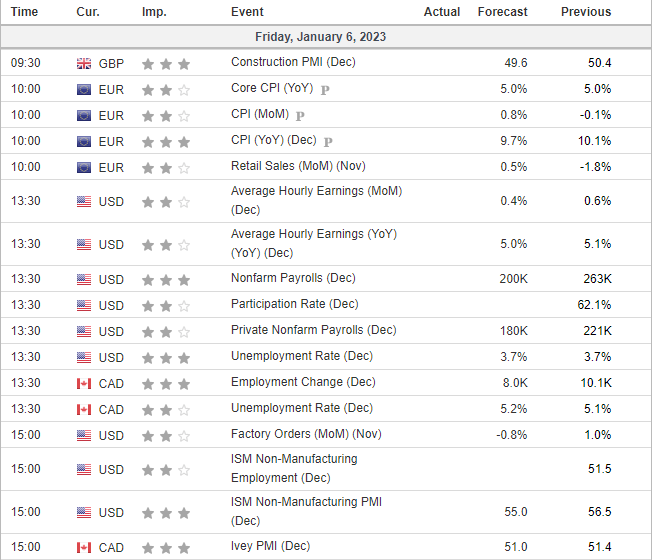
Economic events up next (Times in GMT)
Latest market news
Today 11:14 AM
Today 08:28 AM
Yesterday 03:30 PM
Latest Trade Ideas articles

Today 11:14 AM
Yesterday 11:00 AM
Yesterday 08:15 AM