


Asian Indices:
- Australia's ASX 200 index rose by 20.2 points (0.28%) and currently trades at 7,288.50
- Japan's Nikkei 225 index has risen by 86.24 points (0.31%) and currently trades at 27,666.11
- Hong Kong's Hang Seng index has fallen by -89.95 points (-0.36%) and currently trades at 24,740.04
- China's A50 Index has fallen by -110.85 points (-0.73%) and currently trades at 15,031.74
UK and Europe:
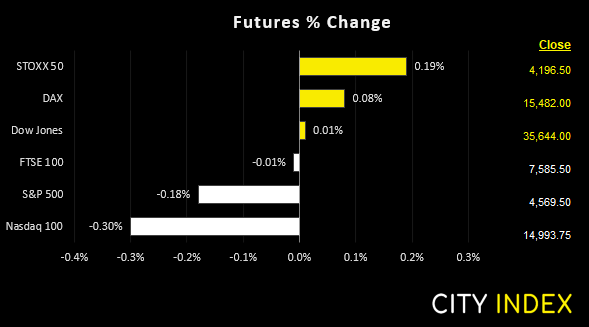
- UK's FTSE 100 futures are currently down -1 points (-0.01%), the cash market is currently estimated to open at 7,642.42
- Euro STOXX 50 futures are currently up 8 points (0.19%), the cash market is currently estimated to open at 4,212.09
- Germany's DAX futures are currently up 12 points (0.08%), the cash market is currently estimated to open at 15,494.01
US Futures:
- DJI futures are currently up 5 points (0.01%)
- S&P 500 futures are currently down -44.75 points (-0.3%)
- Nasdaq 100 futures are currently down -8.25 points (-0.18%)
Equity markets were mixed overnight and volatility was lower ahead of today’s inflation report for the US. China’s indices handed back of some of yesterday’s gains and were the weakest performer, with the CSI 300 down -0.74% and the China A50 of around -0.6%. The ASX 200 was off to a strong start and tested the upper bound of the 7300 – 7342 zone mentioned in today’s Asian open report, yet now appears on track to close with a bearish hammer having handed back around 2/3rd of the day’s earlier gains. Futures markets are also slightly mixed with US indices slightly lower as they retraced against yesterday’s bullish closes.
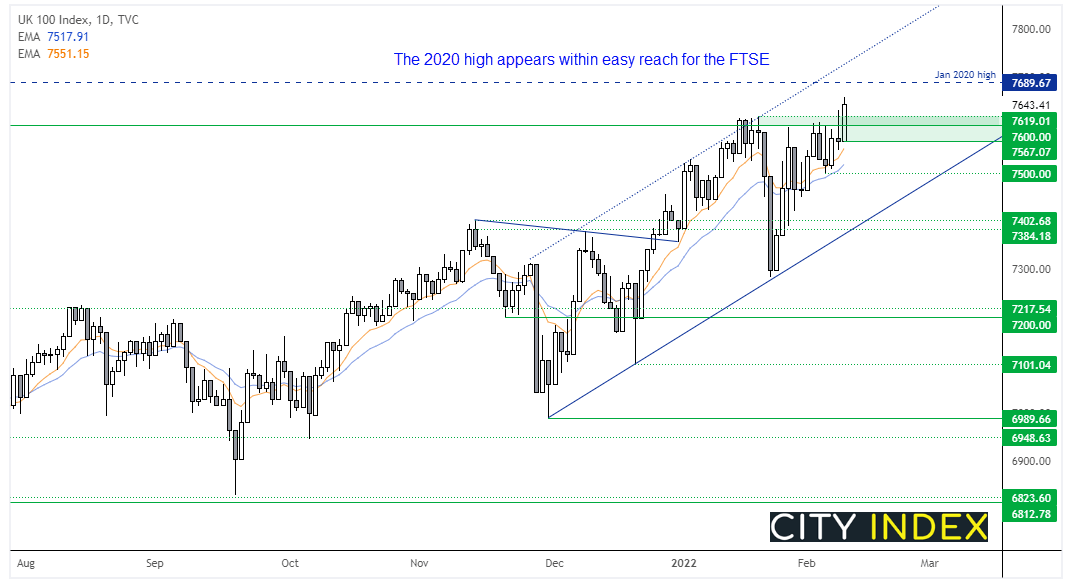
FTSE 100 hit a 2-year high
As always, the FTSE kept us guessing as to whether it would breakout or not. And who could blame us with several failed attempts to do so, with a few reversal candles along the way. Yet by yesterday’s close it had finally broken above 7619 on above-average volume for the day. The British pound is going through a spell of weakness and that could be beneficial for the FTSE to at least hold onto gains. But should prices pull back then obvious areas to seek levels of support include 4600 and 7619. A break beneath yesterday’s low of 7567 invalidates our near-term bullish bias. Until then, we’ll use the Jan 2020 high and the upper trendline as potential bullish targets.
FTSE 100 trading guide>
FTSE 350: Market Internals
FTSE 350: 4310.23 (1.01%) 09 February 2022
- 315 (90.00%) stocks advanced and 33 (9.43%) declined
- 9 stocks rose to a new 52-week high, 4 fell to new lows
- 39.43% of stocks closed above their 200-day average
- 40.29% of stocks closed above their 50-day average
- 19.71% of stocks closed above their 20-day average
Outperformers:
- + 11.26% - Micro Focus International PLC (MCRO.L)
- + 9.70% - TUI AG (TUIGn.DE)
- + 7.45% - Aston Martin Lagonda Global Holdings PLC (AML.L)
Underperformers:
- -3.49% - EVRAZ plc (EVRE.L)
- -2.90% - Chemring Group PLC (CHG.L)
- -2.27% - Tate & Lyle PLC (TATE.L)
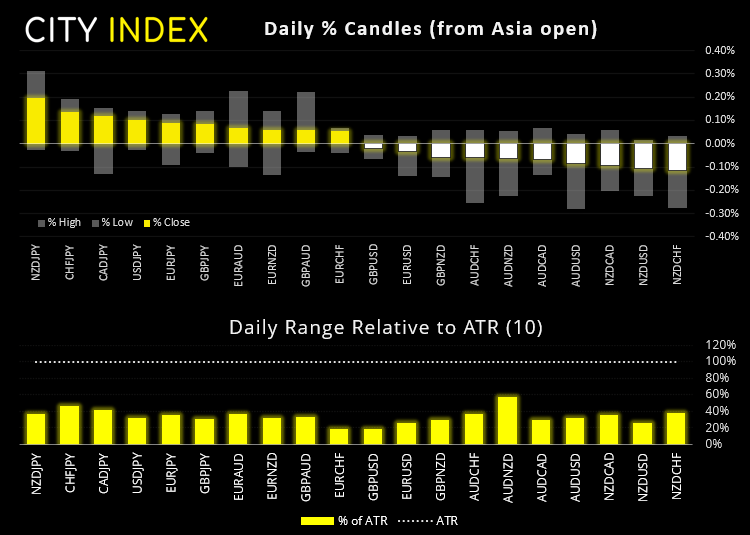
Currencies trade in tight ranges ahead of US CPI
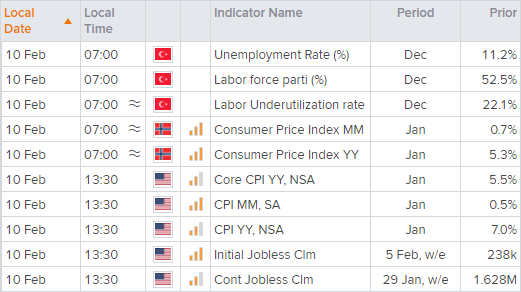
Inflation is expected to rip to a new 40-year high of 7.2% later today. Yes, that is a big number, but it has been well advertised and markets have already fully prices in 4 hikers this year with some expectations of five. Therefore, one has to question how long markets will be scared of the headline number that has been rising for multiple months in a very public way. And more to the point, a number that is already losing momentum. So if inflation undershoots already high expectations it may come as more of a surprise to traders. And it may take a much hotter inflation print than expected to see current trends continue.
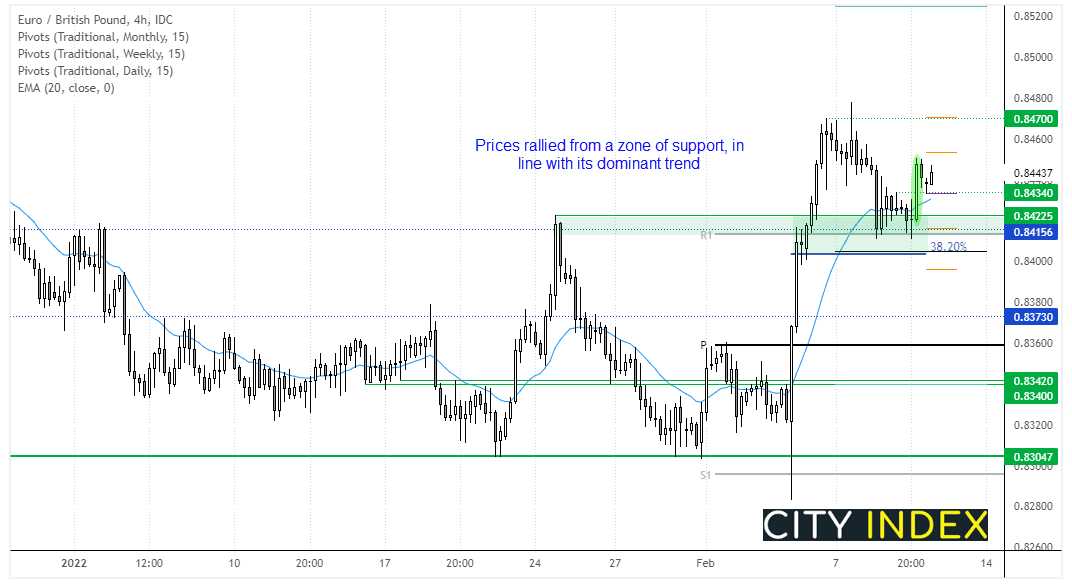
EUR/GBP turns higher, more to follow?
In yesterday’s report we noted that prices were coiling tightly within a triangle on the hourly chart and that could be indicative of pending volatility. It did not disappoint. Whilst the triangle breakout was initially lower, two of the several support levels in close proximity marked the low and momentum has turned higher. Prices have pulled back on the four-hour chart to the 0.8434 high and we’re simply looking for prices to hold above the low of the breakout candle before moving back towards 0.8470.
Up Next (Times in GMT)
How to trade with City Index
You can easily trade with City Index by using these four easy steps:
-
Open an account, or log in if you’re already a customer
• Open an account in the UK
• Open an account in Australia
• Open an account in Singapore
- Search for the company you want to trade in our award-winning platform
- Choose your position and size, and your stop and limit levels
- Place the trade
Latest market news
Today 11:14 AM
Today 08:28 AM
Yesterday 03:30 PM
Yesterday 01:23 PM
Yesterday 11:00 AM
Latest Trade Ideas articles
Today 11:14 AM
Yesterday 11:00 AM
Yesterday 08:15 AM