


June 23, 2022 7:20 AM
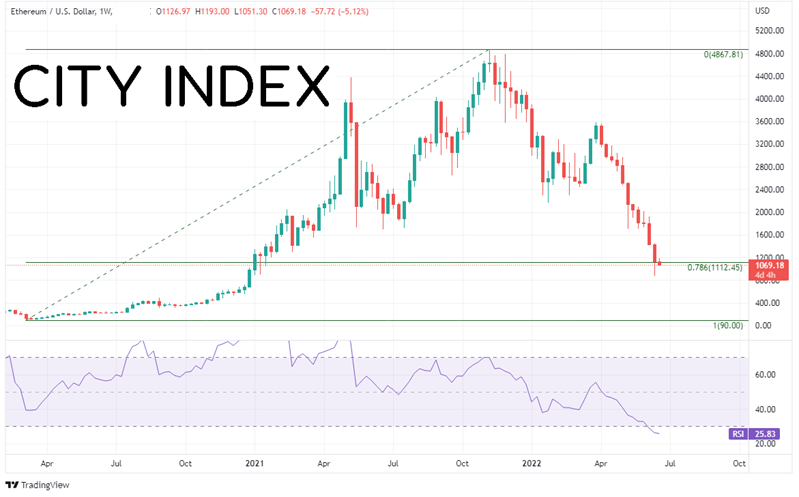
On November 8th, 2021, Ethereum made an all-time high at 4,867.81. Since then, the second most popular cryptocurrency (after Bitcoin, in terms of market cap) has fallen nearly 80%!
As interest rate expectations increase, the value of speculative assets tends to decrease. Buying a government bond is surely a much safer bet than buying Bitcoin or Ethereum. (This is also a major reason stock markets have moved lower).
In addition, specific to Ethereum, the “merge” has been delayed several times, pushing price lower. The merge is supposed to bring Ethereum from a “proof of work” model to a “proof of stake” model. In short, it’s a technical upgrade. The merge is now expected to take place in August.
On a weekly timeframe, Ethereum has fallen to the 78.6% Fibonacci retracement level from the lows the week of March 9th, 2020 to the highs of the week of November 15th, 2021. Ethereum began falling on November 15th, 2021 as interest rate expectations began to creep into the move. The cryptocurrency has been moving lower for the last 12 weeks (including this one), putting in a recent low of 879.80 last week.
Source: Tradingview, Stone X
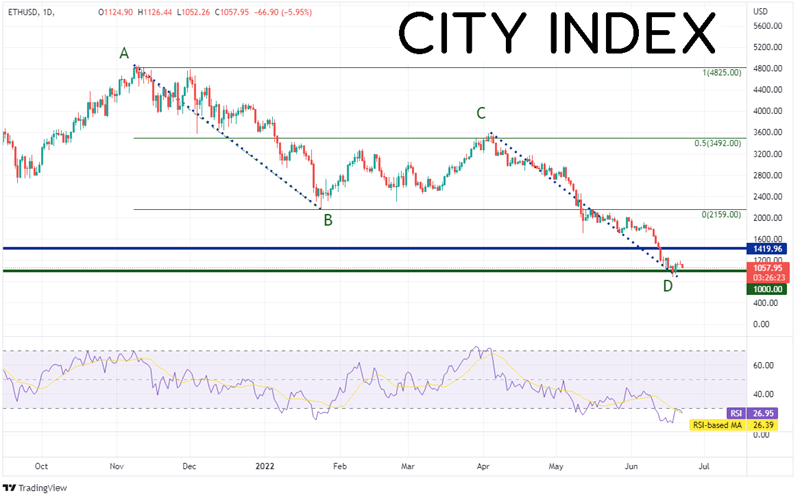
On a daily timeframe, ETH/USD was at its high of 4,867.81 on November 15th when it began selling off. By January 24th, the cryptocurrency reached a low of 2,159. ETH/USD then retraced 50% of the prior move, reaching a local high of 3,555.48 on April 4th. This set up a possible AB=CD pattern, where the length of the move from A to B is equal to the length of the move from C to D. Since then, price continued lower and the target was reached last week when Ethereum hit its most recent low at 879.80.
Source: Tradingview, Stone X
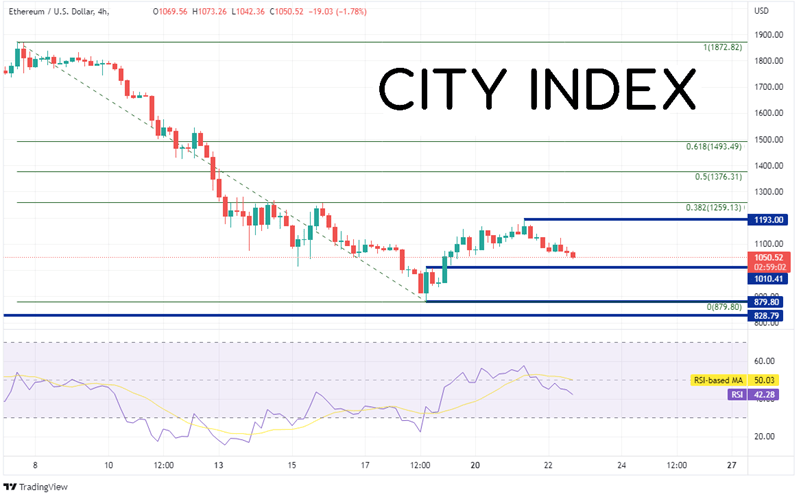
On a 240-minute timeframe, first horizontal support is at 1010.41, then the lows from June 18th at 879.80. Below there is horizontal support dating back to May 2018 at 828.97. However, notice on the daily and weekly timeframes that the RSI is in oversold territory, indicating a possible bounce in the longer-term timeframes. If support holds, first resistance is at the June 21st highs at 1193. Above there, price can move to the 38.2% Fibonacci retracement level from the highs of June 7th to the lows of June 18th at 1259.13 and then the 50% retracement from that same timeframe near 1376.31.
Source: Tradingview, Stone X
Ethereum has been moving lower since November 15th, 2021, including the last 12 weeks in a row. With interest rates expected to continue to increase and as the merge keeps getting delayed, prices are moving lower. Will it continue? It may depend on what other risky assets are doing. If they continue to move lower, Ethereum could move with them.
Learn more about cryptoasset trading opportunities.
Latest market news
Yesterday 01:23 PM
Yesterday 06:01 AM
April 18, 2024 11:27 PM
April 18, 2024 04:46 PM
Latest Trade Ideas articles

April 18, 2024 11:27 PM
April 18, 2024 04:46 PM