


Whilst it is the annual rate of change (yy) that central targets monitor, any healthy change in the annual rate should first occur at the monthly rate (mm). It is therefore worth noting that some metrics of inflation have either seen the monthly reads rise at a slower rate or even contract (deflate). This also coincides with some measures of annualised inflation pulling back.
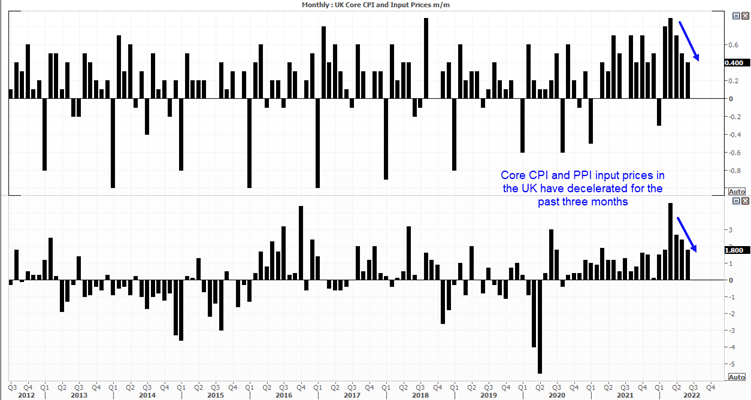
A host of inflation data was released for the UK and Canada today, and there are some promising signs. UK producer input prices slowed to 1.8% m/m, which is the third consecutive month of disinflation (slower rate of growth). Core CPI also slowed to 0.4% m/m which is also its third straight month of disinflation.
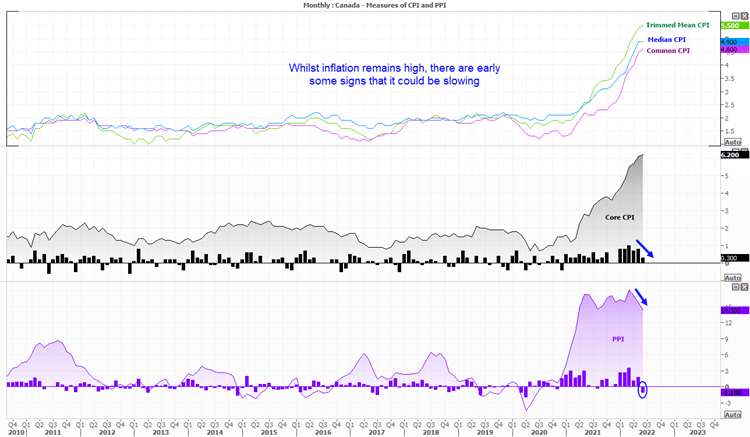
Canada’s producer prices contracted -1.1% in June - its first contraction since August 2021 and at its fastest pace May 2020. Whilst the annualised rate peaking in April at 18.1% could be attributed to basing effects, it is encouraging to see the m/m PPI prints trending their way into contraction – so we’d expect a lower headline PPI going forward. And as producer prices are an input for consumer prices, it comes as good news for consumers further down the track.
In fact Canada’s core CPI rose just 0.3% in June, its slowest rate of expansion this year. And like the PPI m/m read, it has been disinflating. We could therefore make the assumption that the core CPI y/y read is due to top out.
These subtle shifts help keep a lead on where central banks could be headed next
With that said, the BOC (Bank of Canada) pay closer attention to Trimmed mean, Median and Common CPI’s, which are less volatile prints of annualised inflation. And this gives us plenty of time to monitor the data accordingly and get ahead of the game.
Of course, today’s inflation sets are not likely to deter the BOE or BOC from hiking rates at their next meeting. And the BOC are likely to remain one of the more hawkish banks in town. But investors who prefer to see where the central banks are headed and not where they currently are, they’ll pay close attention to the subtle shifts on the m/m rates and (re)invest accordingly.
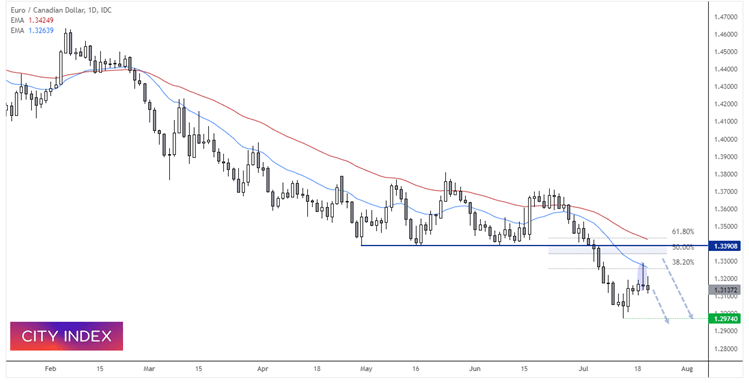
EUR/CAD daily chart:
The ECB meet tomorrow and there has been some excitement over a potential 50-bp hike. For them to really surprise markets we’d need to see a hawkish hike where they announce x 50 or even a 75-bp hike in the foreseeable future. For that reason I see the potential for some disappointment, and a weaker euro afterwards.
EUR/CAD remains in a strong downtrend on the daily chart and it has retraced against that trend. A bearish pinbar formed yesterday and respected the 20-day eMA, and 38.2% Fibonacci level. Perhaps the high is in and prices can now head back to the 1.3000 lows. Should prices instead recycle higher, the near-term bullish bias is towards the 1.3390 resistance zone, at which point we’d reconsider shorts if the technicals and fundamentals align.
How to trade with City Index
You can easily trade with City Index by using these four easy steps:
-
Open an account, or log in if you’re already a customer
• Open an account in the UK
• Open an account in Australia
• Open an account in Singapore
- Search for the company you want to trade in our award-winning platform
- Choose your position and size, and your stop and limit levels
- Place the trade
Latest market news
Latest Technical Analysis articles
April 15, 2024 07:13 PM
April 14, 2024 11:37 PM
April 13, 2024 08:00 PM
April 12, 2024 04:51 AM