


April 27, 2022 12:37 AM
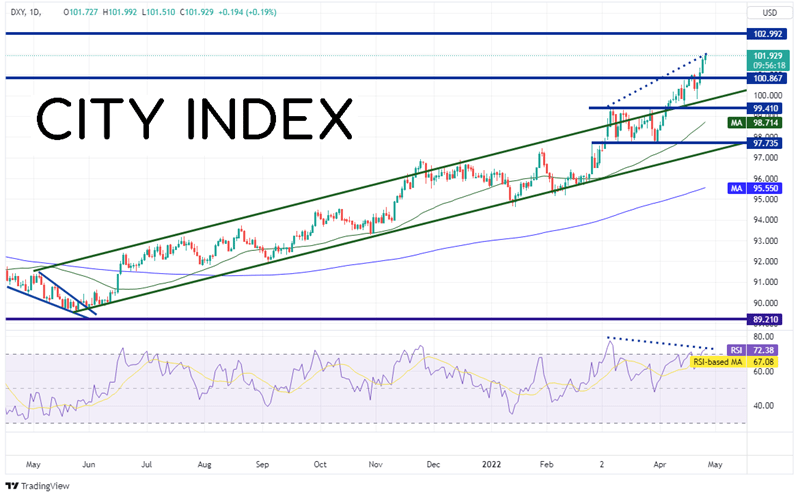
DXY began moving higher in May 2021 as the Fed hinted that it may be ready to begin quantitative tightening. Throughout the last year, inflation increased dramatically, and so did the value of the DXY. The US Dollar Index traded in an orderly rising channel from a low of 89.53 on May 25th until it broke out of the top of the channel to today’s high of 102.07. There are 2 main reasons for the aggressive move higher since April 5th : 1) rumors of faster than previously expected rate hikes 2) lockdowns in China due to the coronavirus, particularly in Shanghai and now possibly even Beijing. It now seems like the US Dollar Index is on a mission to reach the highs from March 2020 at 102.99. However, notice that price is diverging with the RSI, an indication that the DXY may be ready for a near-term pullback.
Source: Tradingview, Stone X
Trade DXY now: Login or Open a new account!
• Open an account in the UK
• Open an account in Australia
• Open an account in Singapore
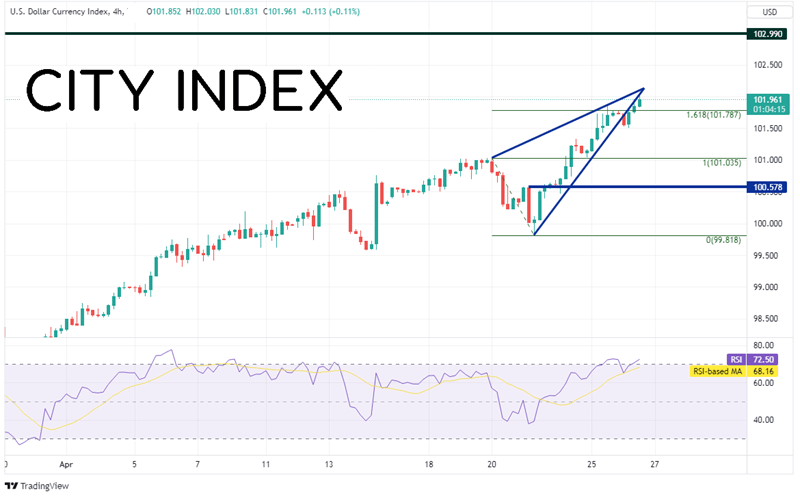
On a 240-minute timeframe, the DXY is trading near the 161.8% Fibonacci extension from the highs of April 20th to the low of April 21st. In addition, the index broke below a rising wedge and is currently testing the underside of the bottom trendline of the wedge. First resistance is at the apex of the wedge near 102.13, just ahead of the March 2020 highs at 102.99. Notice the RSI is also in overbought territory on the short-term timeframe as well, increasing the possibility for a near-term pullback. First support is at today’s low of 101.51. Below there, horizontal support is at 101.04 and 100.58.
Source: Tradingview, Stone X
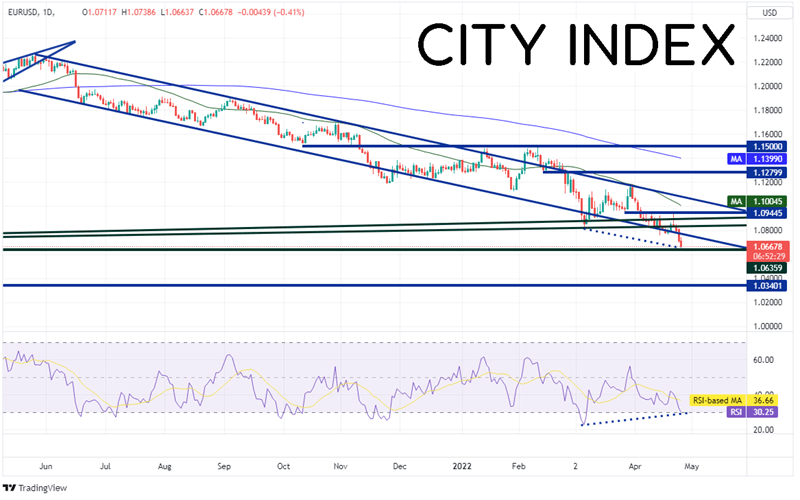
EUR/USD makes up over 57% of the DXY. Therefore, the pair often moves in the opposite direction as the US Dollar Index. On the daily timeframe, the pair has been moving lower in an orderly channel since May 2021 from a high of 1.2263 to today’s low of 1.0662. Just as DXY is approaching the March 2020 highs, EUR/USD is approaching the March 2020 lows at 1.0636. Below there, the next support level isn’t until the lows of January 2017 at 1.0340. However, price and the RSI are diverging, indicating that EUR/USD may be ready for a near-term bounce. First horizontal resistance is at the April 19th lows at 1.0761, then the bottom of the shooting star candlestick on April 21st at 1.0824.
Source: Tradingview, Stone X
Trade EUR/USD now: Login or Open a new account!
• Open an account in the UK
• Open an account in Australia
• Open an account in Singapore
DXY has been on a tear higher for most of the last year. More recently, the US Dollar Index has broken above the top trendline of the upward sloping channel and is gunning for the March 2020 highs. As EUR/USD moves inversely to DXY, if DXY doe reach 102.99, watch for EUR/USD to reach its 2020 lows.
Learn more about forex trading opportunities.
Latest market news
Latest Forex articles

April 17, 2024 02:40 PM
April 17, 2024 04:47 AM