


February 17, 2023 7:15 AM
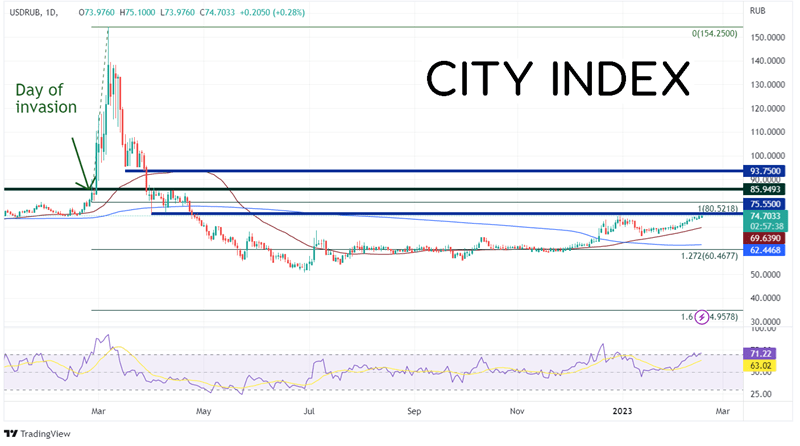
Almost one year ago, Russia senselessly invaded Ukraine. At the time USD/RUB was trading near 85.9493. In the days following the invasion, the pair spiked to a high of 154.25. Over the following month, the pair retraced the entire move as many banks suspended trading of the Ruble and froze Russian assets. Russia hiked interest rates to 20%, leading to a stronger Ruble. In addition, capital controls were put into place to prevent foreign currencies from leaving the country. The value of the Ruble was essentially now a state-controlled currency. The value of USD/RUB fell to a low of 50.65 on June 29th, 2022, and had been trading near 60 throughout the remained of 2022. As a result, nearby counties whose currency value fluctuated with the Ruble became decoupled.
Fast forward a year. The Ruble is still under government control and many countries won’t deal with Russian banks. However, Russia has cut its interest rates to 7.5%, which is lower than some of its Eastern European neighbors. The value of USD/RUB has begun to increase and is currently closing on pre-invasion levels. The pair reached a high of 75.10 on Thursday.
Source: Tradingview, Stone X
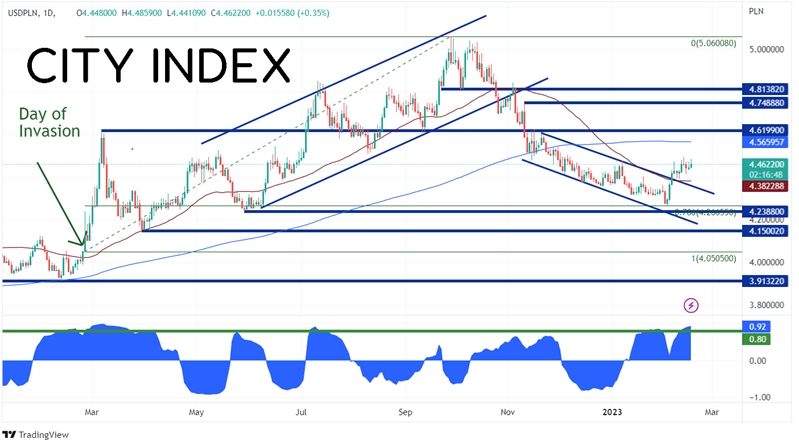
There is one currency pair that has become correlated once again with the USD/RUB. In the bottom panel of the chart below, the correlation coefficient between USD/PLN and USD/RUB rose to 0.92 over the last week. USD/PLN had originally traded higher with USD/RUB as Russia invaded Ukraine. However, as USD/RUB moved to new lows, USD/PLN stalled and began moving higher in an orderly upward sloping channel. The pair made a high on September 29th at 5.0601. Since then, the USD/PLN moved lower, retracing to the 78.6% Fibonacci level of the move since the beginning of the war to the September 29th highs at 4.2666. As long as the correlation coefficient between USD/RUB and USD/PLN remains above +0.80, the correlation is considered strong, and the two currency pairs should move in the same direction.
Source: Tradingview, Stone X
Trade USD/PLN now: Login or Open a new account!
• Open an account in the UK
• Open an account in Australia
• Open an account in Singapore
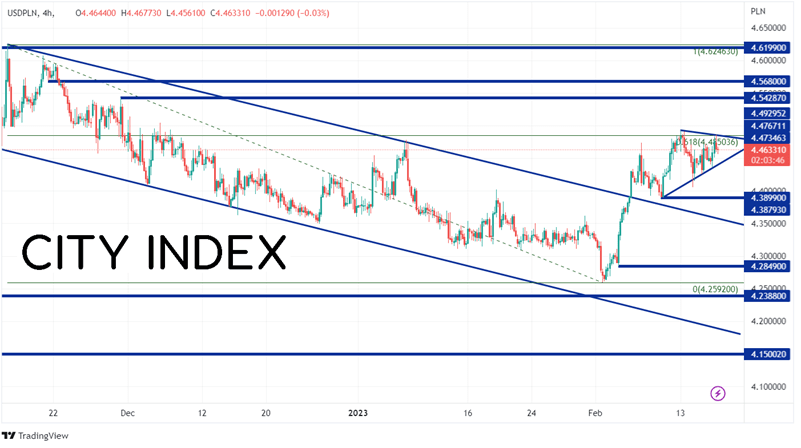
On a 240-minute timeframe, USD/PLN is trading in a symmetrical triangle. If price breaks higher out of the triangle, first resistance is at the highs from November 30th, 2022 at 4.5429. Above there, price can move to the 200-Day Moving Average at 4.5660 (see daily), then addition resistance from November 21st, 2022, at 4.5680. However, if USD/PLN moves lower from the triangle, first support is at a confluence near the lows from February 9th and the 50-Day Moving Average between 4.3823 and 4.3902. Below there, price can fall to the top trendline of the recent channel near 4.3607, then the spike low on February 3rd at 4.2849.
Source: Tradingview, Stone X
Do you want to trade USD/RUB but you can’t? USD/PLN has a high correlation with USD/RUB on the daily timeframe. Therefore, if USD/PLN moves in one direction, USD/RUB should move in the same direction, as long as the correlation remains above +0.80. Therefore, USD/PLN may be a good substitute.
Learn more about forex trading opportunities.
Latest market news
Yesterday 01:23 PM
Yesterday 06:01 AM
April 18, 2024 11:27 PM
April 18, 2024 04:46 PM
Latest Trade Ideas articles

April 18, 2024 11:27 PM
April 18, 2024 04:46 PM