


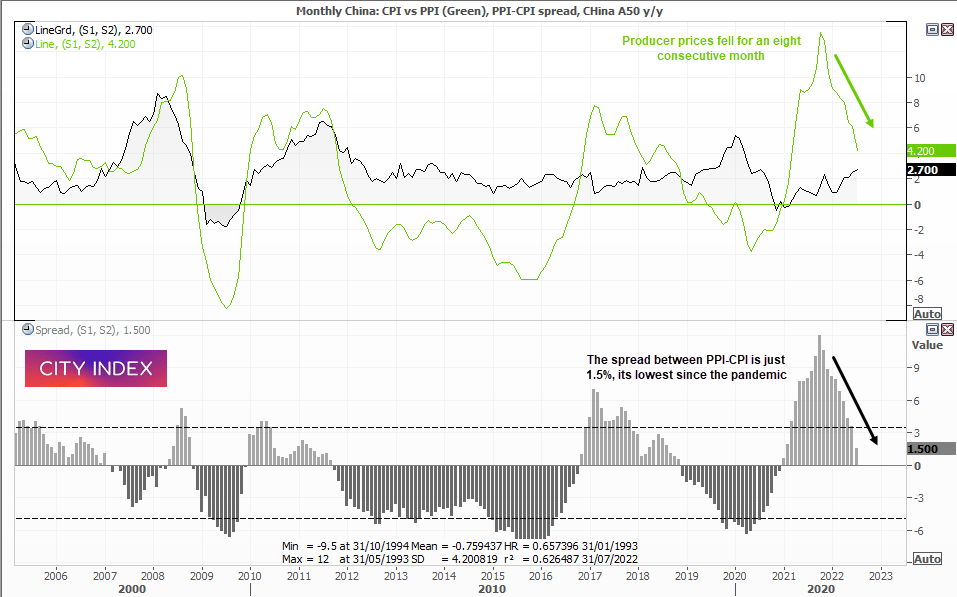


Factory gate prices in China fell to a 17-month low of 4.2% y/y. Producer prices peaked in October at an eye-watering rate of 13.5% y/y and have now fallen for eight consecutive months. Consumer prices rose to a 2-year high of 2.7% yet this is relatively minor in comparison to the inflation rates currently seen in the US. Still, with producer prices on the decline it means there’s less upside pressure on consumer prices going forward, so perhaps they too will top out soon. The spread between PPI-CPI is just 1.5%, its lowest level since the pandemic. So, for China at least, inflation rates are returning to normal levels, which is less of a drag on growth.
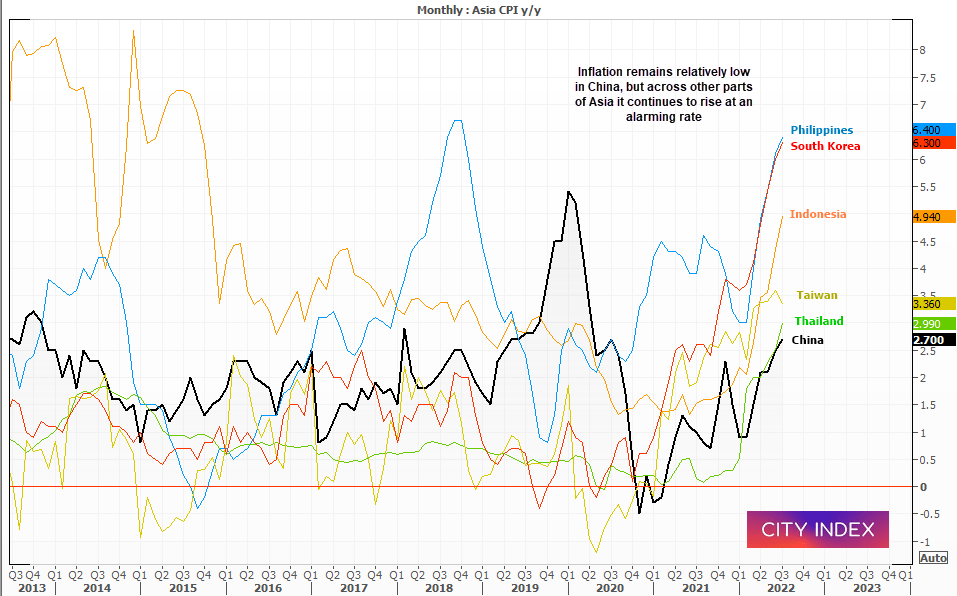
Some of China’s trade partners have much higher levels of inflation
The same cannot be said for other parts of Asia. At 2.7% y/y, China has one of the lowest annual rates of inflation in the region, with Thailand and Taiwan sitting at 3.0% and 3.5% respectively. Yet Philippines has a CPI of 6.4% and South Korea is at 6.3%. And when prices are high for key exporters such as South Korea, it feeds back into higher prices for their trade partners (such as the West). So inflation is essentially part of a global feedback loop, and something to consider for those eagerly wanting to see inflation move lower sooner than later. Personally, whilst inflation in the west has (or is close to ) peaking, I doubt it will disinflate as quickly as many hope. And we can forget about deflation (negative CPI prints) for quite some time.
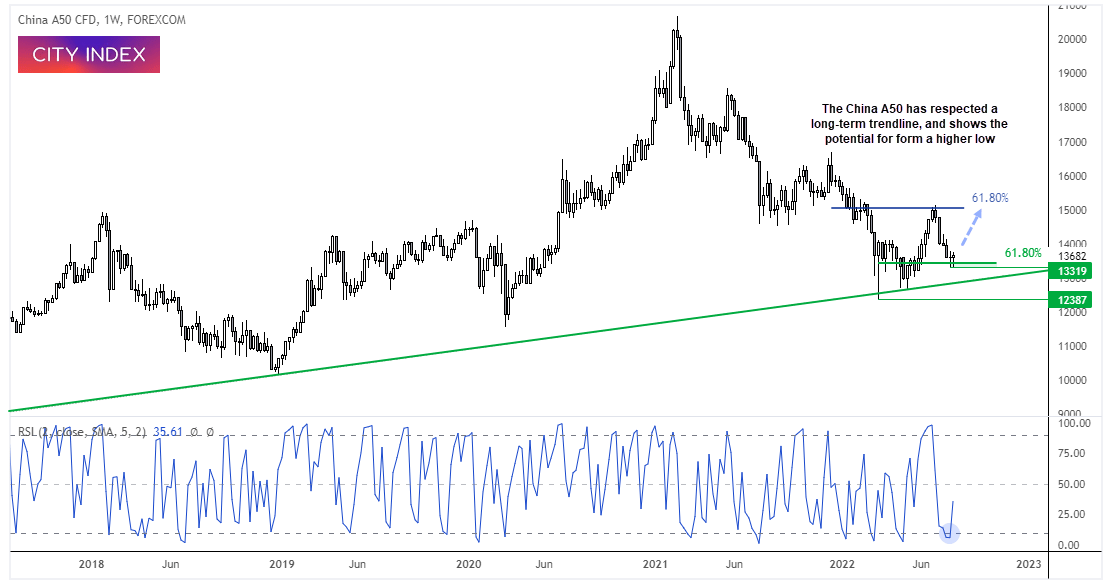
China A50 weekly chart:
In a previous article we highlighted that the China A50 had held above a long-term trendline, and that its bear trend which began in Q1 2021 could be coming to an end. A strong bullish hammer on the weekly chart, higher low and strong rally reinforced this view.
Since rallying towards 15,000 the market has now produced a deep pullback, which has stalled around a 61.8% Fibonacci level. A small Doji formed last week and it is trying to close this week with a small bullish Doji, which suggest we could be approaching a swing low. A break above 15,307 assumes A long-term bull trend is underway.
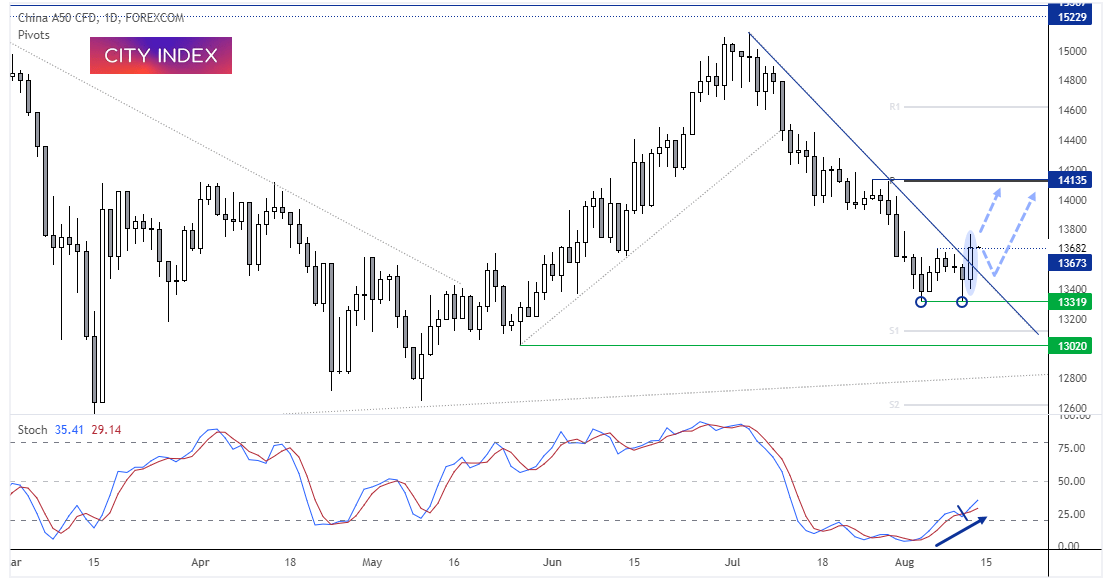
China A50 daily chart:
The China A50 has hinted at a change in trend by breaking its bearish trendline on the daily chart. A double bottom formed at 13,319 with a bullish hammer on Wednesday. A strong bullish candle closed above the trendline and probed the 13,679 swing high. The stochastic oscillator has also generated a buy signal, is tracking prices higher and moved out of oversold. The bias remains bullish above 13,319, but the trendline can also be used to aid with risk management. We now see the potential for a rally to 14,000, or the 14,135 high near the monthly pivot point.
How to trade with City Index
You can easily trade with City Index by using these four easy steps:
-
Open an account, or log in if you’re already a customer
• Open an account in the UK
• Open an account in Australia
• Open an account in Singapore
- Search for the company you want to trade in our award-winning platform
- Choose your position and size, and your stop and limit levels
- Place the trade
Latest market news
Today 11:14 AM
Today 08:28 AM
Yesterday 03:30 PM
Latest Technical Analysis articles
April 22, 2024 04:33 PM
April 21, 2024 11:20 PM
April 15, 2024 07:13 PM