


February 2, 2022 1:41 PM
The Australian economic recovery from the covid pandemic extended strongly throughout FY2021, helping CBA to report a 19.8% in FY earnings to $8,653m and on the back of a strong balance sheet declared a fully franked dividend of $2.00 per share, bringing its full-year dividend payout to $3.50.
Putting the icing on the cake for investors, CBA announced a $6 billion off-market share buyback identified as the most efficient and appropriate way to return the surplus capital accumulated to weather the Covid storm.
However, since the end of FY 2021, the Australian economy has been hit by the Delta variant lockdown in NSW, Victoria, and the ACT, before the onset of the Omicron outbreak in mid-December.
In the drive to provide more certainty given prospects of higher interest rates, mortgage borrowers have been opting to fix their repayments. Fixed-rate loans are less profitable than loans fixed at variable rates.
This factor and strong competition in the sector for market share between the big banks and other mortgage lenders are expected to see a contraction in CBA’s net interest margin (NIM). From 2.03% in FY21 to 1.87% in FY22.
CBA has historically traded at a premium to its peers, and is currently trading on a P/E of 20x above the group average of 18x, despite offering a lower dividend yield of 3.73%.
The price premium is based on the belief that CBA has a more loyal shareholder base, is better managed than its peers, its commitment to investment, and holds a superior distribution franchise.
The market consensus is for CBA to report earnings of $4,500m for 1H2022, with an interim dividend payout of $1.81 per share.
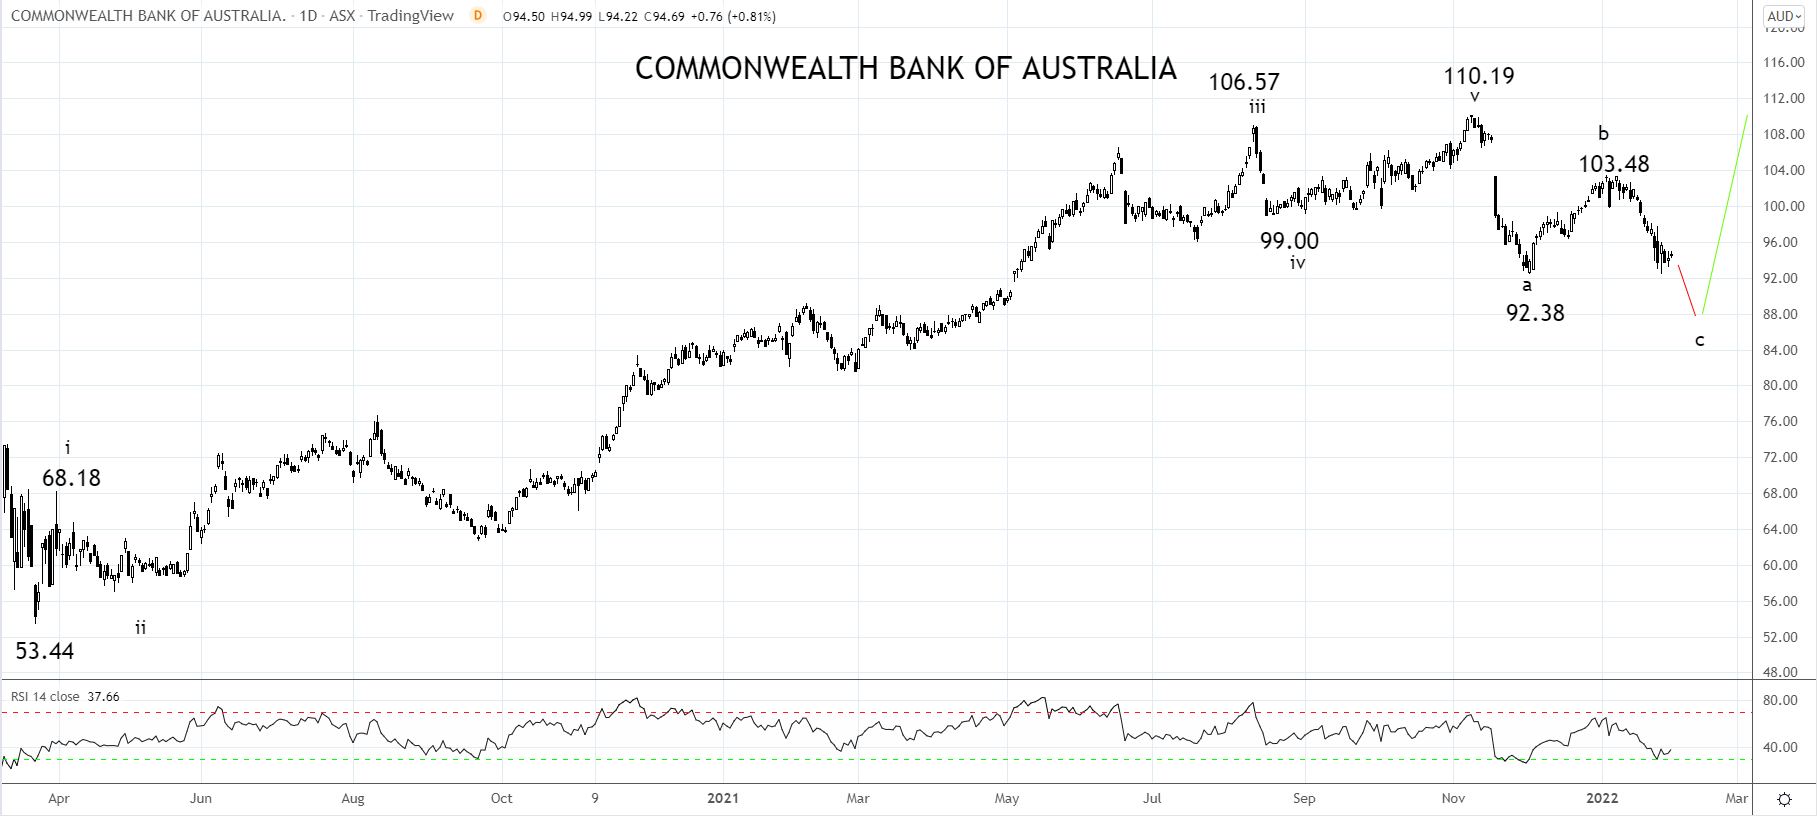
CBA Share Price Chart
In the lead-up to CBA’s report, the share price is trading at $93.93, 7% below where it started the year and over 14% below its November 2021 high of $110.19.
A break of support near $92.30 should see the correction in the share price extend towards wave equality support near $85.00, the preferred level to consider buying CBA.
Source Tradingview. The figures stated areas of the 2nd of February 2022. Past performance is not a reliable indicator of future performance. This report does not contain and is not to be taken as containing any financial product advice or financial product recommendation
How to trade with City Index
You can trade with City Index by following these four easy steps:
-
Open an account, or log in if you’re already a customer
• Open an account in the UK
• Open an account in Australia
• Open an account in Singapore
- Search for the company you want to trade in our award-winning platform
- Choose your position and size, and your stop and limit levels
- Place the trade
Latest market news
Latest Earnings articles

April 16, 2024 08:00 PM
April 14, 2024 04:00 AM
February 20, 2024 02:53 PM