


August 17, 2022 12:57 AM
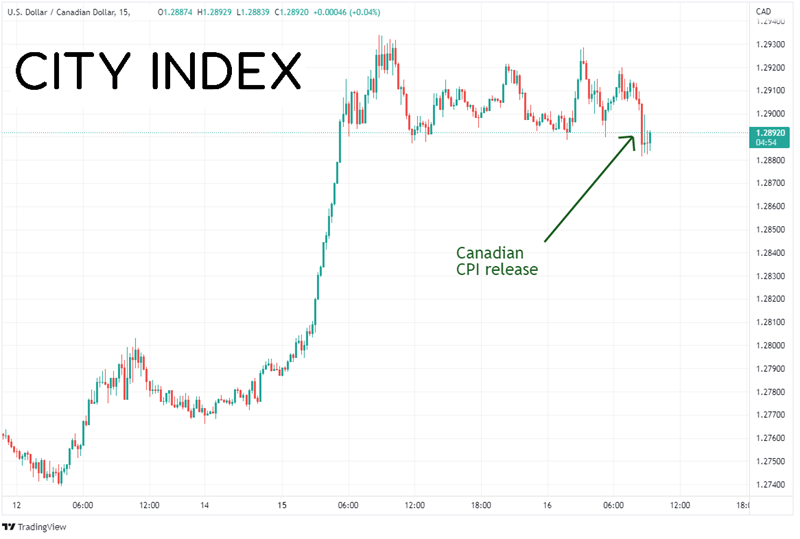
The Canadian July CPI print released today was 7.6% YoY vs an estimate of 7.6% YoY and a June reading of 8.1% YoY! The Core CPI print was 6.1% YoY vs 6.1% YoY expected and 6.2% YoY in June. Similar to the US CPI print from last week, the expectation was for a weaker print than the previous month. The difference: the US CPI actual print was less than estimates, while the actual Canadian CPI was in line with estimates. This is the first time the reading has slowed in over a year. At the last Bank of Canada interest rate decision meeting on July 13th, the BOC hiked rates by 100bps to 2.5%, noting that inflation has become more persistent than previously expected. The Committee also said that it expects inflation to remain around 8% in the next few months. Indeed, since then, as mentioned, CPI rose to 8.1% YoY in June, however then fell to 7.6% YoY in July. Employment data has been weak. This is the last CPI reading the BOC will see before it meets again on September 7th.
Because the US CPI print was weaker than estimates, market participants appear have been expecting the possibility of the same for the Canadian CPI. This may account for the reason that the Canadian Dollar went bid after the print (USD/CAD lower).
Source: Tradingview, Stone X
Trade USD/CAD now: Login or Open a new account!
• Open an account in the UK
• Open an account in Australia
• Open an account in Singapore
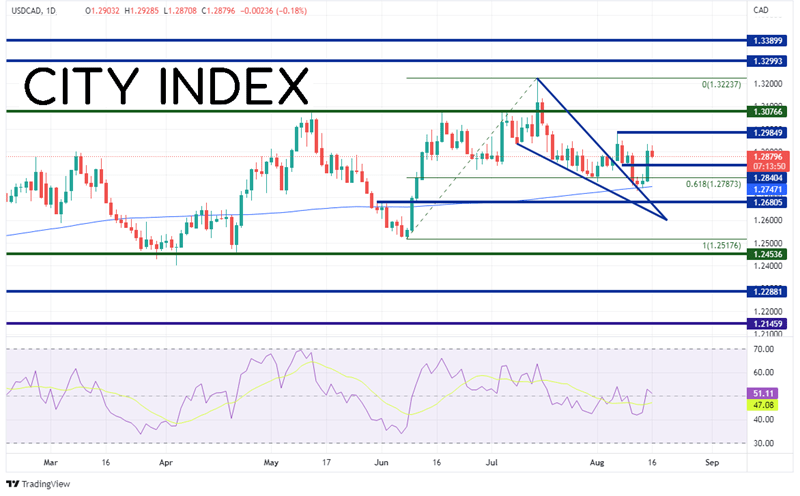
However, on a daily timeframe, USD/CAD is trading within a range between 1.2454 and 1.3075. The pair attempted a breakout above the range on July 14th but failed and moved back inside it. Price then moved lower in a descending wedge formation. After holding the 61.8% Fibonacci retracement level from the lows of June 8th to the highs of July 14th near 1.2787, USD/CAD broke out of the descending wedge on August 5th. Price then pulled back to test the upper descending trendline of the wedge but was thwarted at the 200 Day Moving Average near 1.2840 on August 11th. Since then, USD/CAD has been moving higher due to the China rate cut yesterday (strong US Dollar). The pair is currently trading as an inside day, which if it holds, indicates price may move higher in the near-term.
Source: Tradingview, Stone X
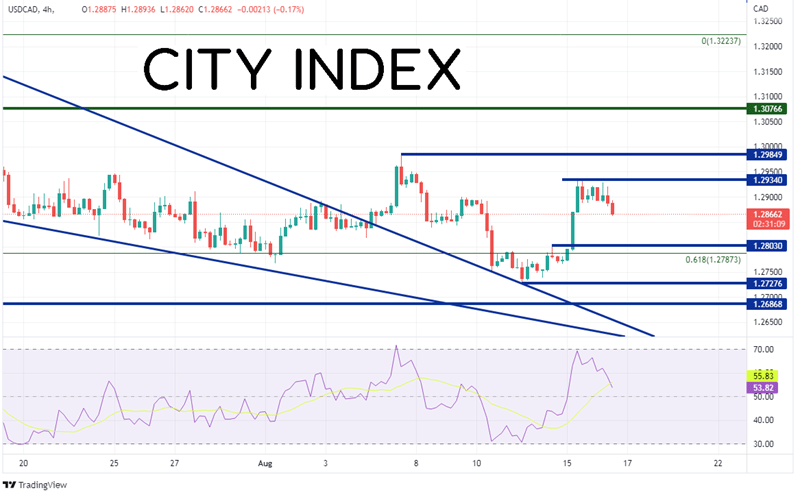
On a 240-minute timeframe, one can better see how USD/CAD has pulled back into yesterday’s range. First horizontal support is at 1.2803, followed by the lows from August 11th at 1.2632. If price breaks below there, it can fall to horizontal support dating back to May 31st at 1.2687. First resistance is at yesterday’s highs of 1.2834, then the highs of August 5th at 1.2985. If price breaks above there, the next resistance isn’t until the top of the long-term channel at 1.3076, then the spike highs from July 14th at 1.3224.
Source: Tradingview, Stone X
The July Canadian CPI print came in weaker than June’s print and USD/CAD sold off. Traders may have been expecting an even weaker print, similar to that of the US CPI. The BOC doesn’t meet again until September 7th. Although Canada may have seen peak inflation, the BOC will still have to get inflation to its target of between 2% and 3%.
Learn more about forex trading opportunities.
Latest market news
Today 01:15 PM
Today 11:30 AM
Today 08:18 AM
Latest Forex articles


Yesterday 11:30 AM
Yesterday 03:42 AM