


August 5, 2022 1:52 AM
The markets will be focusing on US Non-Farm Payroll data tomorrow, but don’t forget that Canada will release its July Employment Change as well. The Unemployment Rate is expected to remain unchanged at 4.9%. Expectations for the Employment Change are for a gain of 25,000 jobs vs a June reading of -43,200. However, note that most of the job losses from the June headline print were due to a decrease of 39,100 part-time jobs. Full-time employment only lost 4,000 jobs. Expectations for July are for a gain of 15,000 full-time jobs and a gain of 10,000 part-time jobs. Recall that the Bank of Canada hiked its overnight rate by 100bps at its July 13th meeting and noted that inflation is likely to remain around 8% over the next few months. They also decreased the growth forecast for 2022 and 2023. A stronger jobs print would be a welcome sign to the BOC as it moves forward in the rate hike cycle. The next BOC interest rate decision isn’t until September 7th; however, this is two days before August Employment Change is to be reported. Therefore, tomorrows print will be the last jobs data report the BOC will see before its next meeting.
Everything you need to know about the Bank of Canada
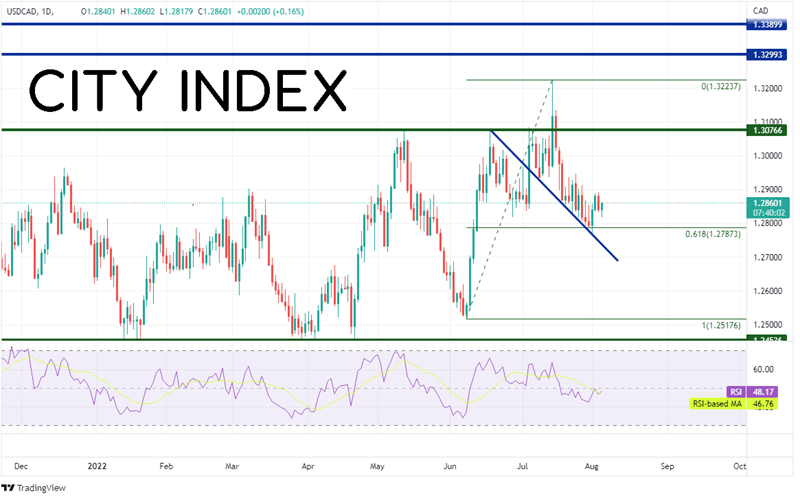
USD/CAD has been trading in a range between 1.2454 and 1.3077, less 2 days in July when the pair reached a high of 1.3224 then pulled back into the range. After price pulled back into the range it continued lower along a trendline dating to June 17th. The low of the move thus far is 1.2767, however the lowest close for the move is 1.2788, which is the 61.8% Fibonacci retracement level from the lows of June 8th to the highs of July 14th.
Source: Tradingview, Stone X
Trade USD/CAD now: Login or Open a new account!
• Open an account in the UK
• Open an account in Australia
• Open an account in Singapore
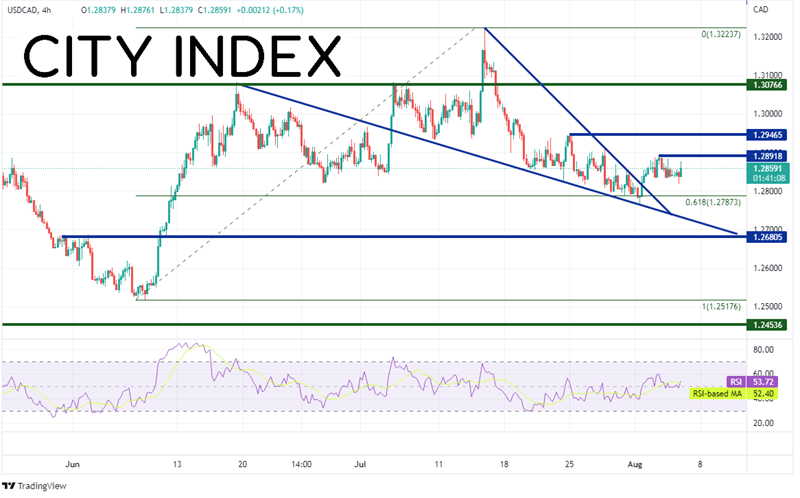
On a 240-minute timeframe, price had been falling in a descending wedge formation. On August 1st, USD/CAD broke above the downward sloping trendline of the wedge. The target for the breakout of a descending wedge is a 100% retracement. In this case, the target is 1.3224! First resistance is at the highs from August 2nd at 1.2892 and then the highs from July 25th at 1.2947. Above there, USD/CAD can move to the top of the long-term range at 1.3077. First support is at the lows of August 1st at 1.2767 and then the bottom, downward sloping trendline from the descending wedge near 1.2730. If price breaks below, there is some minor support at 1.2680, but then price can fall all the way to the June 7th lows at 1.2517!
Source: Tradingview, Stone X
The Canadian Employment data will be released tomorrow. If the data is better than expected, this will help give the BOC confidence to hike again when it meets in September. However, if the data is worse than expected, the central bank may have second thoughts about continuing to hike rates at such a rapid pace.
Learn more about forex trading opportunities.