


AUD/USD takeaways
- The RBA’s rate hike earlier this week is overwhelming a run of disappointing economic data out of Australia and China.
- China inflation data in Friday’s Asian session will be key for AUD/USD’s near-term direction.
- AUD/USD is testing near-term resistance at 0.6710, a break above could expose the 200-day EMA or 0.6800.
Australian dollar fundamental analysis
It’s been a fascinating week for the Australian economy.
After the RBA shocked markets by hiking interest rates 25bps to 4.10% on Tuesday, we’ve seen a run of disappointing data that may have Governor Lowe and company second-guessing their decision:
- Wednesday’s Q1 GDP came out at 0.2% q/q, a tick below the 0.3% reading expected.
- Later that day, China (Australia’s biggest trade partner) revealed disappointing import and export figures for May.
- In today’s Asian session, Australia reported a disappointing trade balance figure of its own, highlighted by a 5% fall in exports in April.
Looking ahead to Friday’s Asian session, AUD/USD traders will key in on China’s CPI and PPI inflation releases, which are expected to show essentially stagnant prices for consumers and an outright contraction in producer prices for the eighth consecutive month.
Australian dollar technical analysis – AUD/USD daily chart
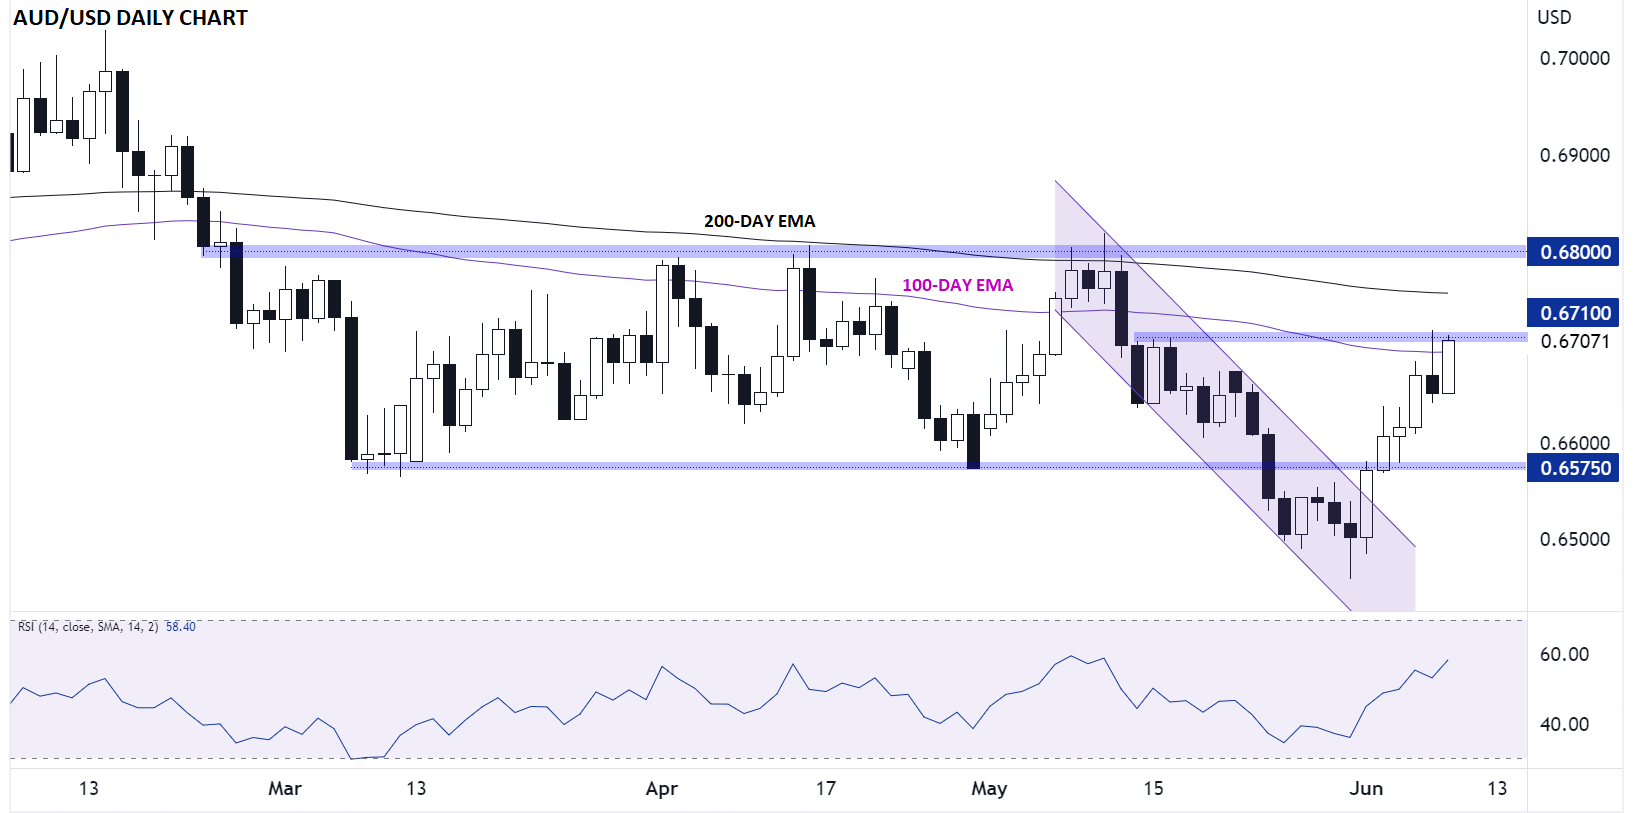
Source: TradingView, StoneX
From a technical perspective, AUD/USD has shrugged off the somber mid-week data, focusing instead on the surprise RBA rate hike as the most important driver for the pair. Perhaps in anticipation of a hawkish central bank surprise, the pair broke out of its bearish channel late last week and rates are now on track to rise for the fifth day out of the past six, gaining more than 200 pips over that period.
As we go to press, AUD/USD is testing a key short-term resistance level at 0.6710, the highest level the pair has traded at in a month. If bulls are able to maintain the momentum and take rates above that zone, a continuation toward the 200-day EMA at 0.6760 or the 3-month highs near 0.6800 could be next.
At this point, even a short-term pullback toward 0.6600 wouldn’t necessary flip the bias back in favor of the bears with key previous support in the 0.6575 area.
-- Written by Matt Weller, Global Head of Research
Follow Matt on Twitter: @MWellerFX
How to trade with City Index
You can trade with City Index by following these four easy steps:
-
Open an account, or log in if you’re already a customer
• Open an account in the UK
• Open an account in Australia
• Open an account in Singapore
- Search for the market you want to trade in our award-winning platform
- Choose your position and size, and your stop and limit levels
- Place the trade
Latest market news
Yesterday 08:33 AM
Latest Forex articles
April 17, 2024 02:40 PM
April 17, 2024 04:47 AM
April 16, 2024 12:00 PM
April 16, 2024 04:24 AM