


Monday US cash market close:
- The Dow Jones Industrial fell -413.04 points (-1.19%) to close at 34,308.08
- The S&P 500 index rose -75.75 points (2.51%) to close at 34,058.75
- The Nasdaq 100 index fell -337.051 points (-2.35%) to close at 13,990.21
Asian futures:
- Australia's ASX 200 futures are down 0 points (-0.15%), the cash market is currently estimated to open at 7,485.20
- Japan's Nikkei 225 futures are down -100 points (-0.37%), the cash market is currently estimated to open at 26,721.52
- Hong Kong's Hang Seng futures are up 298 points (1.41%), the cash market is currently estimated to open at 21,506.30
- China's A50 Index futures are down -4 points (-0.03%), the cash market is currently estimated to open at 13,565.10
Bond yields continued to rise overnight and dampen appetite for equities as traders increasingly expected a 50-bps hike at next month’s FOMC meeting. Fed fund futures are now pricing in an 82.1% chance of a 50-bps hike, which saw the Nasdaq lead the way lower with a -2.35% decline and the Philadelphia semiconductor index (SOX) fall -2.4%. All S&P 500 fell -1.7% and all of its sectors were in the red led by energy and technology stocks, the Dow fell -1.2%.
ASX 200:
The ASX 200 scraped a 0.1% gain after handing back nearly all its earlier gains yesterday. Whilst 65% of its stocks advanced, 5 of its 11 sectors declined which underscores what a mixed bag it was overall. Yet its 1-day reversal pattern, close beneath 7500 and weak lead from Wall Street warns of the potential for weakness today.
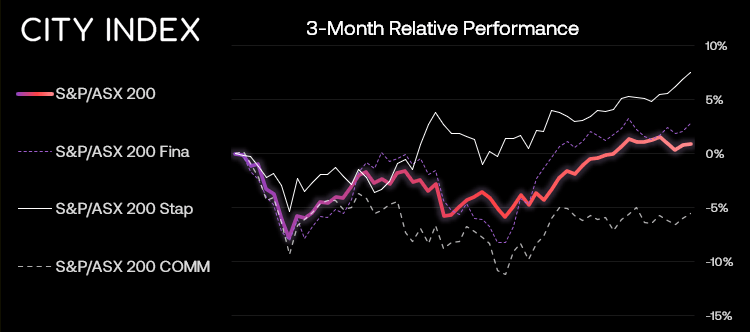
Looking over the past week it been a defensive play with the consumer staples sector closing at a year-to-day high, and utilities rising to its highest level since August 2020. Meanwhile, the tech sector touched a 3-week intraday low yesterday and consumer discretionary technology hit a 1-month low. Until we see these pattern reverse it seems likely the ASX 200 will remain in a choppy phase with the potential for a deeper pullback before its trend resume.
ASX 200: 7485.2 (0.10%), 11 April 2022
- Financial (0.78%) was the strongest sector and Info Tech (-0.85%) was the weakest
- 6 out of the 11 sectors closed lower
- 4 out of the 11 sectors outperformed the index
- 130 (65.00%) stocks advanced, 54 (27.00%) stocks declined
Outperformers:
- +10.14% - Zimplats Holdings Ltd (ZIM.AX)
- +6.99% - Lake Resources NL (LKE.AX)
- +5.99% - APM Human Services International Ltd (APM.AX)
Underperformers:
- -5.8% - AVZ Minerals Ltd (AVZ.AX)
- -5.61% - Yancoal Australia Ltd (YAL.AX)
- -5.36% - A2 Milk Company Ltd (A2M.AX)
Dollar remains firm ahead of inflation data
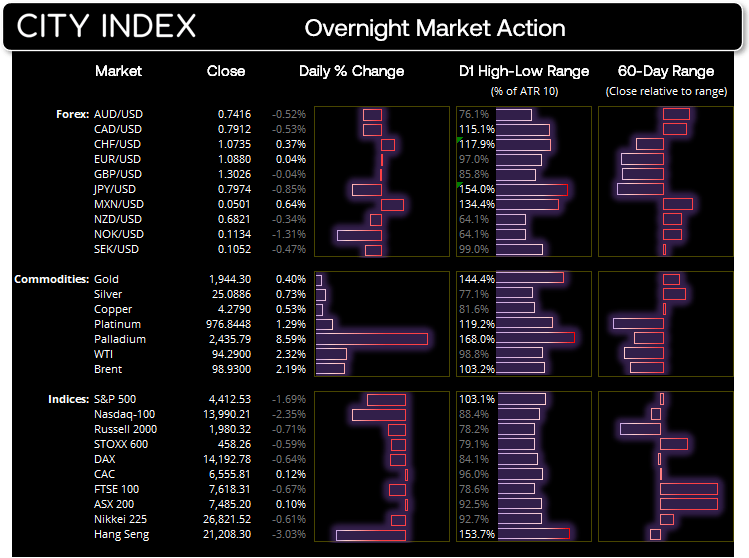
The US dollar remains strong heading into today’s CPI data from the US. IN fact it is the strongest major month-to-date whilst the Japanese yen remains the weakest, helping USD/JPY rose to within a cast-whisker of the 2015 high overnight. USD/CAD rose to a 3-week high and tested its 200-day eMA from underneath, AUD/USD and NZD/USD hit a 14-day and 18—day low respectively.
The euro was also strong and extended its gains after Macron beat Le Pen in the first round of the French election. EUR/JPY rose almost 1% as it broke out of compression and approached the March high.
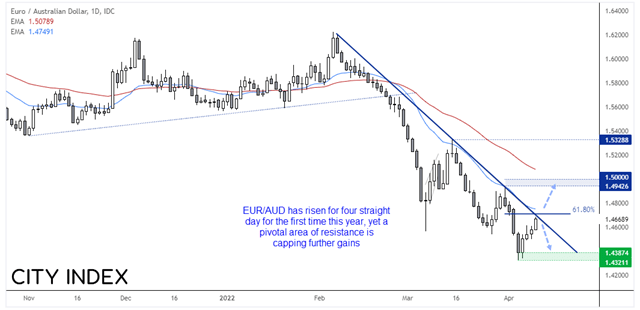
EUR/AUD is also on focus as its 4-day rally is now probing trend resistance. It remains in a clear downtrend in the daily chart yet now within a retracement phase, helped by strong sentiment towards the euro after round 1 of the presidential election. Yet the bearish trendline is capping the rally, the 61.8% Fibonacci retracement sits around 1.4710 and 20-day eMA at 1.4750. SO there is chance of a pullback from current levels or even a swing high to form, making the 1.4710/50 zone and important area to watch as it is clearly a pivotal level over the near-term.
Euro explained – a guide to the euroCommodities performance was mixed
Gold initially touched a 4-week high and intraday break above 1950, yet its reversal and eventual close beneath that key resistance level shows of a hesitancy to properly breakout. Yet demand clearly resides around 1900 as each dip is gladly bought. Silver also saw a decent breakout of trend resistance and probed $25 to revitalise our bullish bias after a month of choppy retracement trading.
How to trade with City Index
You can easily trade with City Index by using these four easy steps:
- Open an account, or log in if you’re already a customer
- Search for the company you want to trade in our award-winning platform
- Choose your position and size, and your stop and limit levels
- Place the trade
Latest market news
Yesterday 11:48 PM
Yesterday 11:16 PM
Yesterday 05:00 PM
Yesterday 01:13 PM
Latest Trade Ideas articles
Yesterday 11:48 PM
Yesterday 11:16 PM
Yesterday 05:00 PM
Yesterday 11:00 AM