


Asian Futures:
- Australia's ASX 200 futures are closed, the cash market is currently estimated to open at 6,828.70
- Japan's Nikkei 225 futures are up 170 points (0.57%), the cash market is currently estimated to open at 30,259.25
- Hong Kong's Hang Seng futures are up 114 points (0.4%), the cash market is currently estimated to open at 29,052.74
Monday US Close:
- The Dow Jones Industrial rose 373.98 points (1.13%) to close at 33,527.19
- The S&P 500 index rose 58.04 points (1.45%) to close at 4,077.91
- The Nasdaq 100 index rose 268.648 points (2.02%) to close at 13,598.16
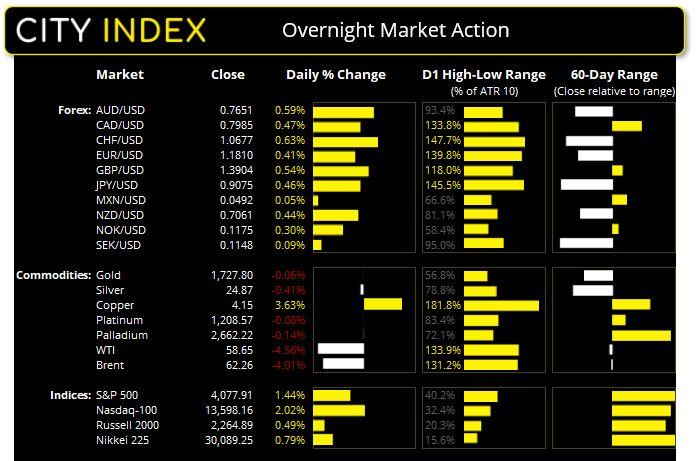
US Indices rise to record highs on strong economic data
US data for April continued to smash expectations, lifting the S&P 500 and Dow Jones to fresh record highs. The ISM services index jumped to a record high in March, with new orders following suit with its own record high of 67.2 and employment rising to 57.2, its highest level since May 2019. Prices paid rose to 74.0, which is its most inflationary level since July 2008.
This follows on from a strong set of business sentiment and employment data heading into Easter. On Thursday, ISM manufacturing rose to a 37 year high of 64.7, up from 60.8. New orders were the highest since 2004 and the employment component also rose to a 3-year high. And on Friday Nonfarm payrolls blew past expectations and added 916k jobs versus 647k expected, up from 468k previously (which was itself upwardly revised from 379k).
It is the second consecutive session for the S&P 500 above 4,000 and bullish momentum is increasing to see prices push further away from their 10-day eMA. Market internals also screamed “bullish” with 409 stocks advancing overnight versus 95 declining and all but the energy sector rising with the index in tandem. The Nasdaq 100 closed just shy of 13,600 and at a 6-week high. At its current rate of volatility, it could retest its record high in a couple of sessions if bulls retain control.
Learn how to trade indices.
Forex: AUD remains firm ahead of today’s RBA meeting
No change is expected at today’s RBA meeting and, as they have a strong tendency to announce anything vaguely exciting in public before a meeting, no change is all but confirmed today. AUD/USD closed to a 2-week high thanks to a weaker US dollar overnight and printed a bullish engulfing candle on the daily chart. Given the bullish hammer which closed back above head and shoulders top neckline on Thursday, we now see the potential for this to bounce higher. A break above last week’s high of 0.7664 confirms a near-term bullish reversal.
- AUD/NZD printed a bullish inside day after retracing -1.3% from its high last week. Given prices hold above a bullish trendline projected from the February low, perhaps a swing low is trying to be carved out.
- AUD/CAD closed higher for a third consecutive session although its daily trend remains bearish below 0.9643. A bearish reversal candle below this resistance level could be of interest to bears for a potential swing trade short.
- USD/JPY fell to a two-day low amid its most bearish session since early February. Now trading around 110.00 bears need to break prices below 109.85 support to suggest a meaningful correction against its aggressively bullish trend is underway.
Worst day for the dollar in nearly two-months
It was the most bearish session in nearly two months for the US dollar index (DXY), as strong economic data saw the inverse correlation between equities and the dollar return. Since its low at the end of March there have been two clear waves of buying which has obviously coincided with USD majors coming under pressure. But if economic data remains firm and equities continue to soar higher, it could well weigh on the dollar broadly and send the US dollar index lower.
Yesterday’s bearish outside candle closed on its bullish trendline form the 25th of February low and just above 92.50 support. Whilst this pivotal level could provide a minor technical bounce over the near-term we fancy its chances of breaking support and heading towards the 91.30/40 lows.
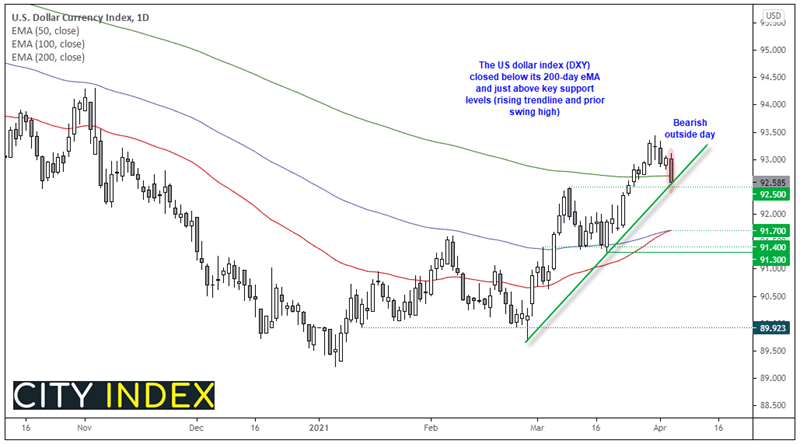
- A break below 92.50 invalidates the bullish trendline and brings the 91.30 low into focus.
- 91.7 could be an interim target as this is where the 100 and 50-day eMA’s reside.
- The bias remains for a break of the trendline whilst prices remain beneath the bearish outside candle’s high. So, this does allow for a minor rebound from current levels first.
Learn how to trade Forex
Commodities: Oil falls to range lows
Oil prices fell over -4% overnight during thin trade, with fears of lower demand and higher production weighing on sentiment. WTI’s price action on the daily chart remains choppy with every session over the past eight rising or falling over 3% between the 57.25 – 62.27 range. Although yesterday’s bearish engulfing candle suggests bears may try to break prices to the downside of this range under the current climate.
Gold trades around 1727 and just beneath the highs of last week’s bullish pinbar. A double bottom formation is being carved out with two clear rejections around 1676, although we’d want to see a break above the 1760/64 resistance zone to confirm it.
Up Next (Times in AEST)
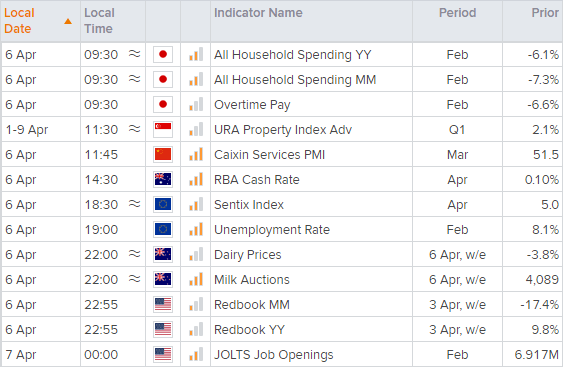
You can view all the scheduled events for today using our economic calendar, and keep up to date with the latest market news and analysis here.
Latest market news
Today 01:15 PM
Today 11:30 AM
Today 08:18 AM
Latest DXY articles

April 10, 2024 11:24 PM
April 8, 2024 03:35 AM
April 4, 2024 10:28 PM