


Friday US cash market close:
- The Dow Jones Industrial rose 564.67 points (1.65%) to close at 34,725.47
- The S&P 500 index rose 105.34 points (2.44%) to close at 4,431.85
- The Nasdaq 100 index rose 451.501 points (3.22%) to close at 14,454.61
Asian futures:
- Australia's ASX 200 futures are down -16 points (-0.23%), the cash market is currently estimated to open at 6,972.10
- Japan's Nikkei 225 futures are down -40 points (-0.15%), the cash market is currently estimated to open at 26,677.34
Whilst US equity markets rebounded on Friday their gains for the week were mild at best.
We are now at the phase of the move where volatility remains elevated whilst direction remains fickle around the 200-day eMA (for the S&P 500 and Dow Jones at least) but, until we see a clear breakout from recent choppy ranges, more chop could be expected.
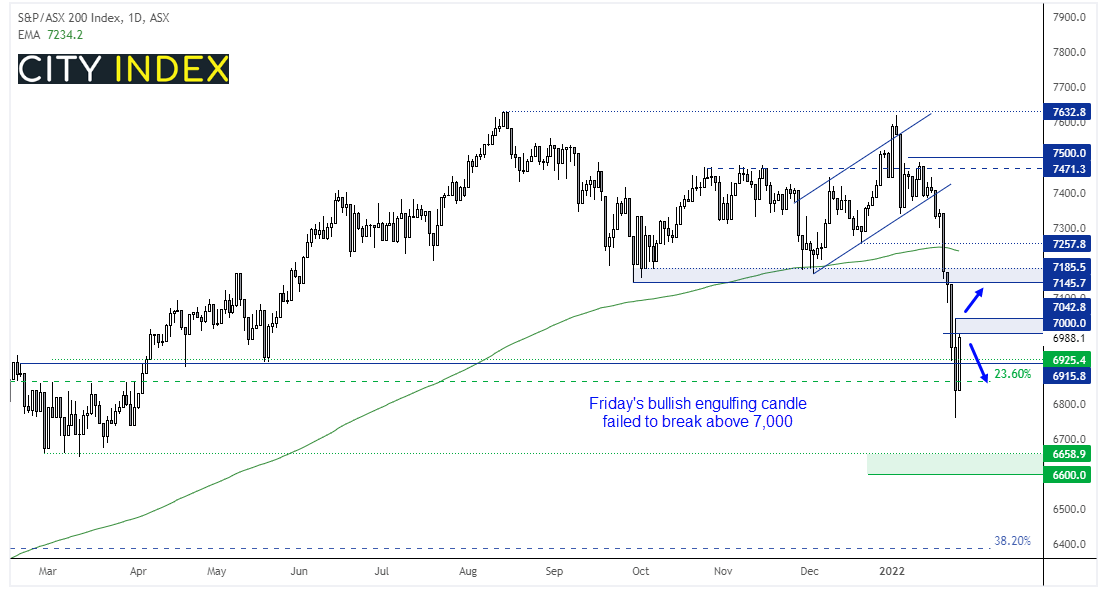
ASX 200 on track for its worst month since the Pandemic
Currently down -6.2% in January, the ASX 200 is on track for its most bearish month since March 2020. It would also require a miraculous recovery over the net two days to avoid a large bearish engulfing month. Today’s key focus is on whether it can recover back above 7,000, a level which held on Friday despite posting a bullish engulfing day. Although we’d really want to see a break above 7043 before considering this bounce could have legs, which would then bring 7100 and 7145 into focus for countertrend traders. Whilst prices remain below the 7,000 – 7,043 range then it could just as easily roll over once more.
Read our guide on the ASX 200 trading guide
ASX 200: 6988.1 (2.19%), 28 January 2022
- Consumer Discretionary (3.27%) was the strongest sector and Energy (0.82%) was the weakest
- 11 out of the 11 sectors closed higher
- 6 out of the 11 sectors outperformed the index
- 31 (15.50%) stocks advanced, 165 (82.50%) stocks declined
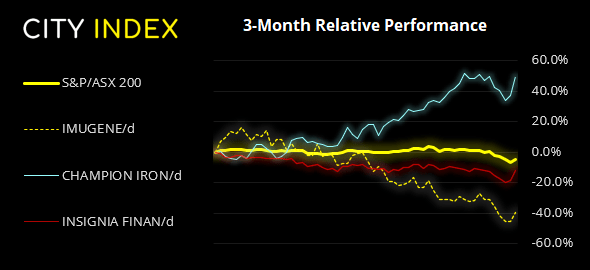
Outperformers:
- +10.5% - Imugene Ltd (IMU.AX)
- +8.75% - Champion Iron Ltd (CIA.AX)
- +7.90% - Insignia Financial Ltd (IFL.AX)
Underperformers:
- -7.16% - Meridian Energy Ltd (MEZ.AX)
- -6.36% - Newcrest Mining Ltd (NCM.AX)
- -6.28% - Mercury NZ Ltd (MCY.AX)
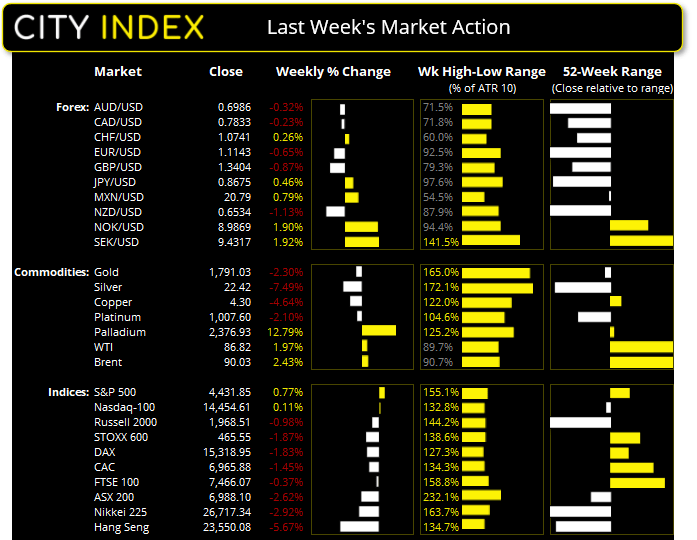
USD was the strongest currency last week
The US dollar was the strongest major currency last week after the FOMC made it loud and clear hike and policy normalisation are coming. Bond yields screamed higher to support USD, and weighing on antipodean currencies in particular with AUD and NZD falling over -2.5% for the week.
USD/JPY reached our initial target of 115 and reached a near-3-week high although Friday’s bearish hammer warns of a pause or retracement. USD/CAD hit a 3-week high and stopped just shy of 1.2800 despite stronger oil prices and the BOC (Bank of Canada) also signalling a hike in March. EUR/USD closed below 1.12 for the first time in 19-month although Friday’s small Rikshaw Man Doji warns of over-extension at the lows. Not wanting to miss out, AUD/USD also closed at its lowest level since June 2020 and below 70c.
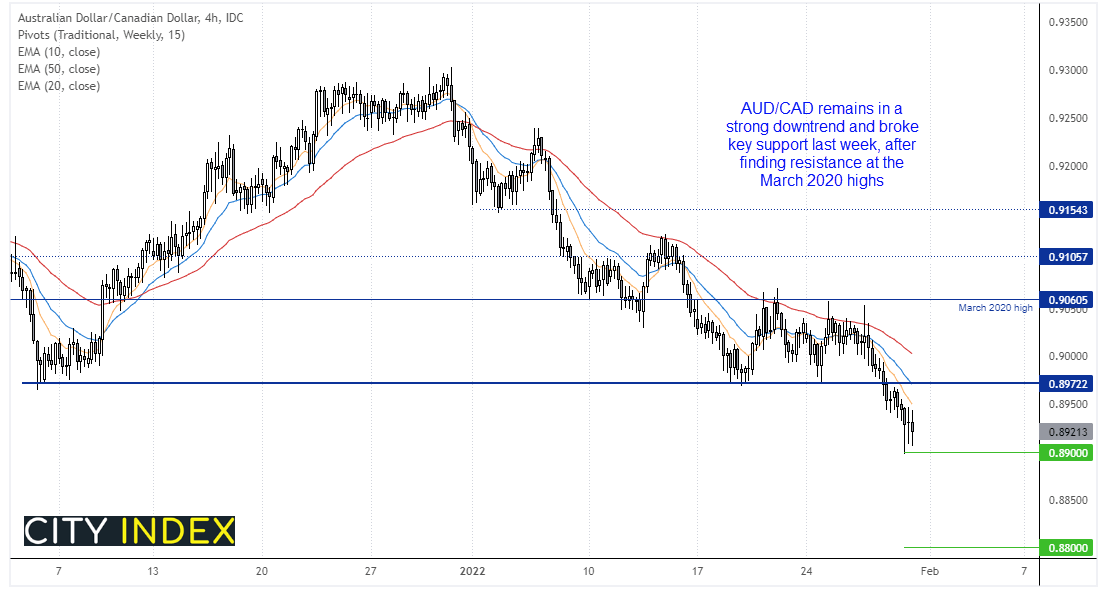
AUD/CAD hit a 21-month low ahead of tomorrow’s RBA meeting
AUD/CAD currently sits at a 21-month low after breaking beneath the December low on Thursday. A hawkish BOC continued to favour the Canadian dollar over the Australian dollar as RBA are nowhere near even discussing hiking rates themselves, although we may see them remove QE at tomorrow’s meeting.
It’s possible we may see AUD/CAD pullback from these lows during quieter trade today but, given the strength of its bearish trend on the four-hour chart was suspect it can eventually move down to 0.8850 or even 0.8800. Before the break it moved in a sideways range yet found sellers happy to step in at the March 2020 highs, so we’re now looking for the pattern to repeat should prices pull back towards old support at 0.8972.
Read our guide on the Australian Dollar
Gold remains in its multi-month triangle
Our downside targets for gold were achieved last week although it should be noted that the lower trendline of a multi-month triangle provided support on Friday. Whilst rising real yields and a strong US dollar remain a headwind for the yellow metal it does appear set for a corrective bounce from current levels, but a key focus for today’s sessions are whether it can break (or hold) back above 1800 where the 200-day eMA resides.
Silver broke trend support on Friday yet closed back above it, which (like gold) shows its potential for a minor bounce from a technical standpoint.
Chinese New Year this week
With domestic markets closed all week we expect volumes to remain on the low side during the Asian session until next Monday. That said, it is a public holiday in Hong Kong each day this week except tomorrow.
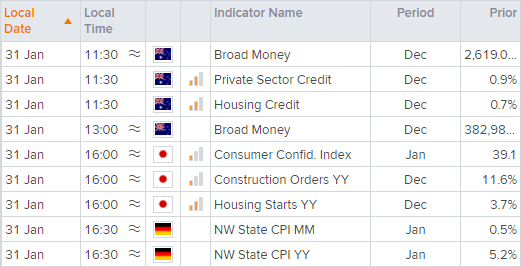
Up Next (Times in AEDT)
The OECD (Organisation of Economic Development) release their outlook for New Zealand today. Housing credit for Australia is scheduled for 11:30 AEDT, although eyes are really on tomorrow’s RBA meeting to see whether they will end their $350 bond buying programme.
How to trade with City Index
You can easily trade with City Index by using these four easy steps:
-
Open an account, or log in if you’re already a customer
• Open an account in the UK
• Open an account in Australia
• Open an account in Singapore
- Search for the company you want to trade in our award-winning platform
- Choose your position and size, and your stop and limit levels
- Place the trade