


- EUR/USD reached an 18-day high following reports that the ECB may be more aggressive with rate hikes.
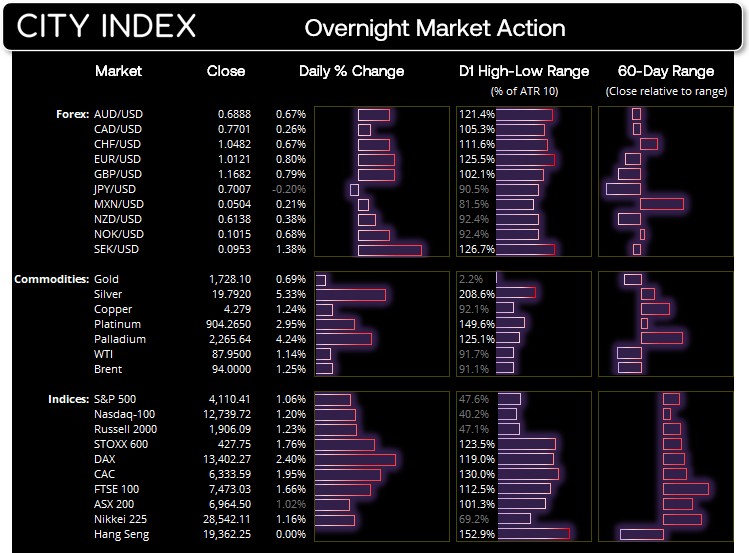
- Appetite for risk remained firm on Monday due to expectations of softer US inflation in today’s report, and a series of military defeats for Russia over the weekend.
- A measure for consumer inflation expectations in the US fell to 5.7% y/y overnight.
- The Fed are expected to raise interest rates by 75bp next week, regardless of today’s inflation figures. But if inflation does soften in today’s report traders will assumes less aggressive hikes going forward, which could help support stocks and weigh on the US dollar.
- Of course, the reverse is also true; if inflation rises then it increases the odds of more aggressive Fed hikes and could weigh on indices and support the US dollar.
- Annual CPI is expected to soften to 8% (from 8.5%) and have contracted by -0.1% in August. However, annual core CPI is expected to rise to 6.0% y/y, up from 5.9% previously.
- China’s equity markets reopen today following a public holiday on Monday.
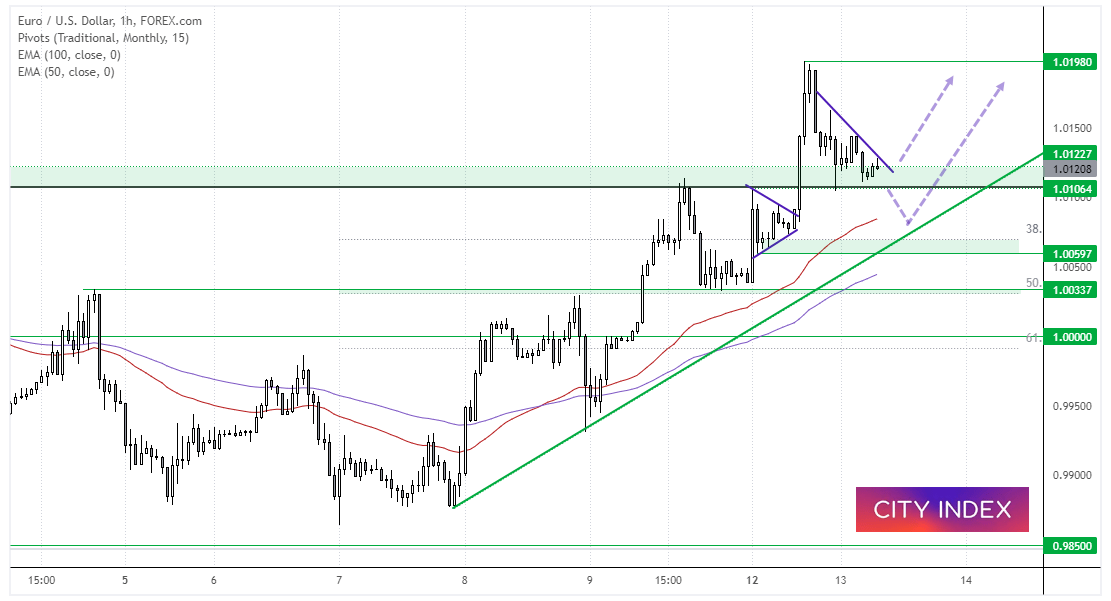
EUR/USD 1-hour chart:
EUR/USD remains in a strong uptrend on the 1-hour chart, and prices are now retracing from its 18-day high. Prices are holding above a support zone around the monthly pivot point, although a break lower could see the 50-bar EMA or bullish trendline providing support. If inflation comes in softer (as hoped) then it could markets such as the euro take advantage of a weaker US dollar.
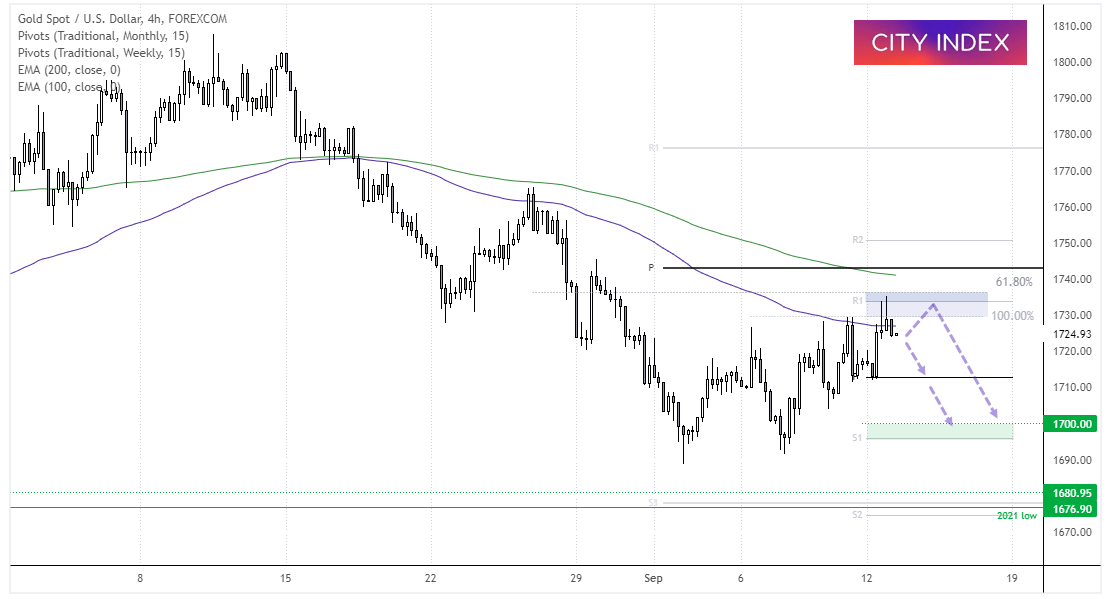
Gold 4-hout chart:
A bearish trend developed from the 1807 high and found support around 1690. Since then prices action has grinded higher in a fashion that appears corrective. More recently it has struggled to hold onto gains around 1720 – 1730 which suggests the market is trying to top out. A bearish Pinbar and bearish hammer formed around the 100-bar EMA, weekly R1 pivot and Fibonacci cluster. The bias is for a move down to the weekly pivot point, a break beneath which brings the 1700 support zone into focus.
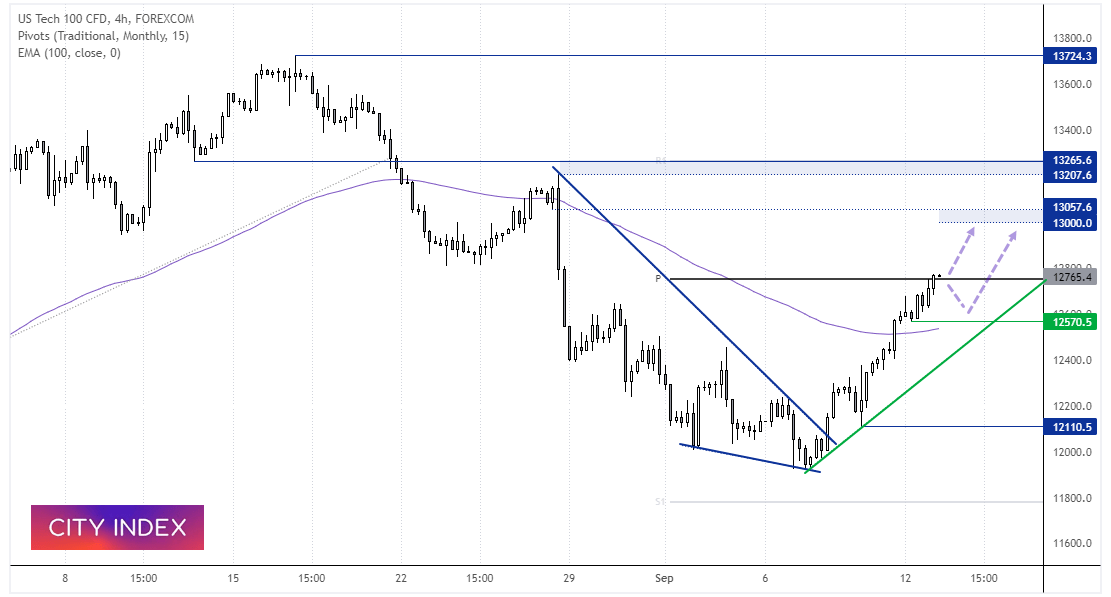
Nasdaq 4-hour chart:
The Nasdaq 100 rose for a fourth consecutive day and to a two-week high. The 4-hour chart remains in a strong uptrend and retracement have been very small, to underscore the trend’s strength. A bullish engulfing candle formed which shows demand around 12,570, so our bias remains bullish above this level. We’re now looking for prices to rally to 13,000, should US inflation soften as anticipated.
How to trade with City Index
You can easily trade with City Index by using these four easy steps:
-
Open an account, or log in if you’re already a customer
• Open an account in the UK
• Open an account in Australia
• Open an account in Singapore
- Search for the company you want to trade in our award-winning platform
- Choose your position and size, and your stop and limit levels
- Place the trade
Latest market news
Yesterday 01:23 PM
Yesterday 06:01 AM
April 18, 2024 11:27 PM
April 18, 2024 04:46 PM
Latest Technical Analysis articles
April 15, 2024 07:13 PM
April 14, 2024 11:37 PM
April 13, 2024 08:00 PM
April 12, 2024 04:51 AM